Fig. 8
Download original image
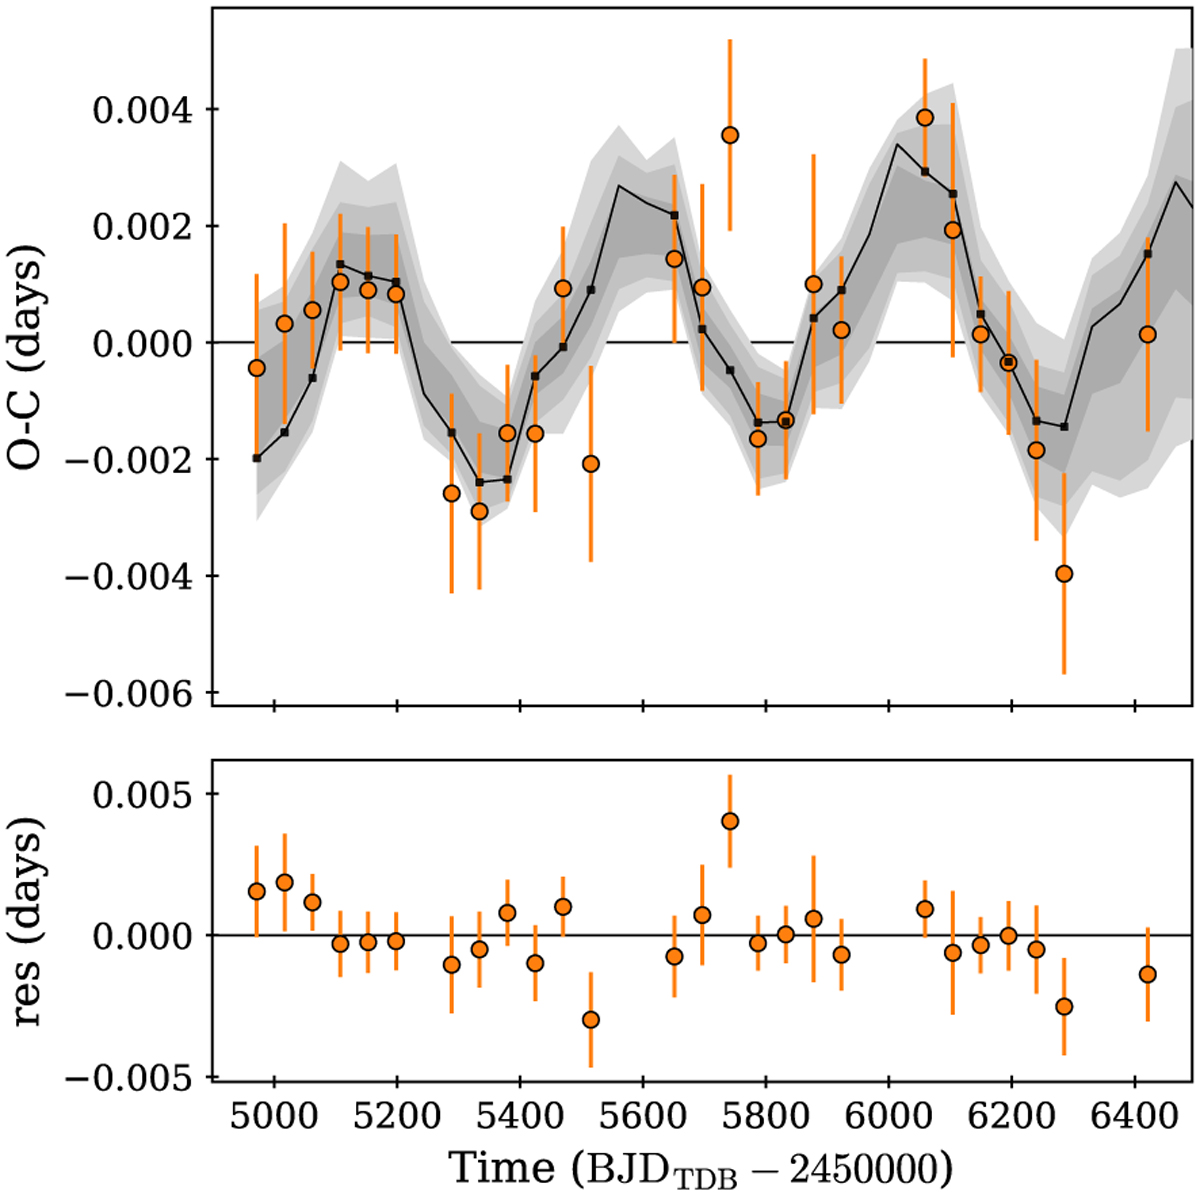
Kepler-10 c O-C diagram, defined as in Fig. 3. Top panel: observed (orange circles) TTVs, the best-fit model (black circles and line), and the gray areas are the 1, 2, and 3σ uncertainty (from darker to lighter) of 100 samples drawn from the posterior distribution. Bottom panel: residuals between the observed Tc and simulated ones with TRADES.
Current usage metrics show cumulative count of Article Views (full-text article views including HTML views, PDF and ePub downloads, according to the available data) and Abstracts Views on Vision4Press platform.
Data correspond to usage on the plateform after 2015. The current usage metrics is available 48-96 hours after online publication and is updated daily on week days.
Initial download of the metrics may take a while.