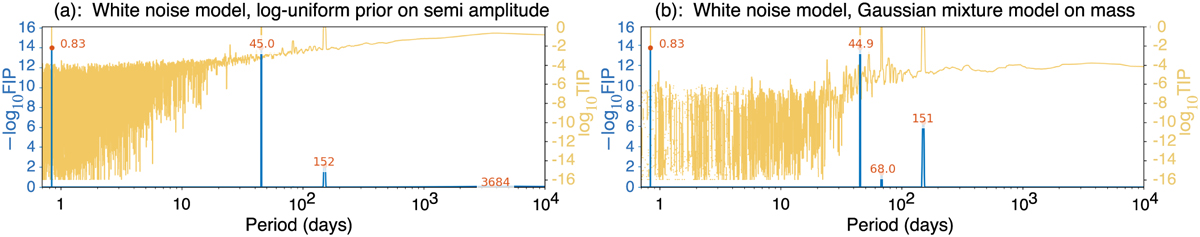
Fig. 5
Download original image
False inclusion probability periodograms of the Kepler-10 HARPS-N data processed with YARARA-v2 for different priors on semiamplitude. (a) was obtained with a log-uniform prior on semiamplitude, (b) with a Gaussian mixture model on mass. In yellow we represent the true inclusion probability (TIP), the probability of having a planet in the range [ω−Δ ω, ω+Δ ω] as a function of ω. In blue, we represent −log 10 FIP, where FIP =1 – TIP is the false inclusion probability.
Current usage metrics show cumulative count of Article Views (full-text article views including HTML views, PDF and ePub downloads, according to the available data) and Abstracts Views on Vision4Press platform.
Data correspond to usage on the plateform after 2015. The current usage metrics is available 48-96 hours after online publication and is updated daily on week days.
Initial download of the metrics may take a while.