Fig. 2
Download original image
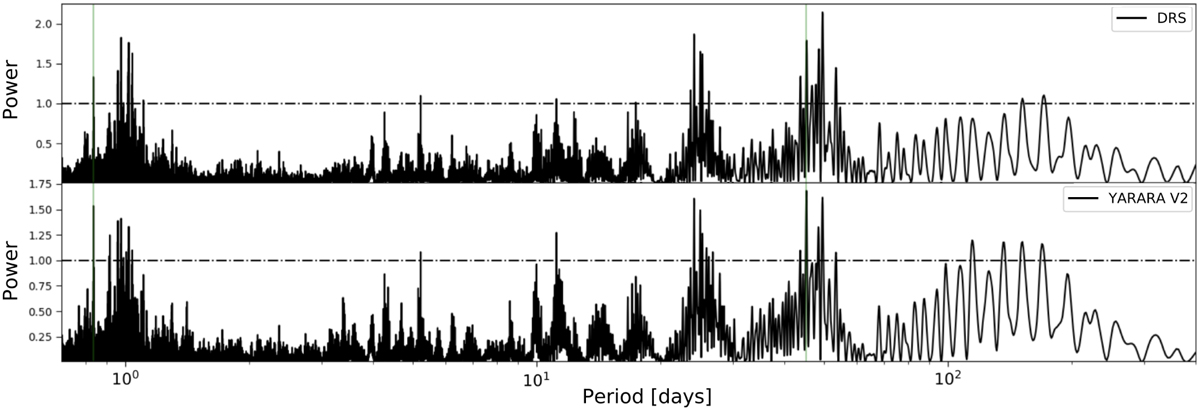
Generalized Lomb-Scargle periodograms of the 236 HARPS-N radial velocities as reduced with the new DRS (top panel) and the new DRS+YARARA-v2 (bottom panel). The power of the periodograms was normalized by the 1% false alarm probability (FAP) level. Note the increase in power of the peaks at the periods of Kepler-10 b and Kepler-10 c (vertical green lines) with the YARARA-v2 reduction.
Current usage metrics show cumulative count of Article Views (full-text article views including HTML views, PDF and ePub downloads, according to the available data) and Abstracts Views on Vision4Press platform.
Data correspond to usage on the plateform after 2015. The current usage metrics is available 48-96 hours after online publication and is updated daily on week days.
Initial download of the metrics may take a while.