Fig. B.3
Download original image
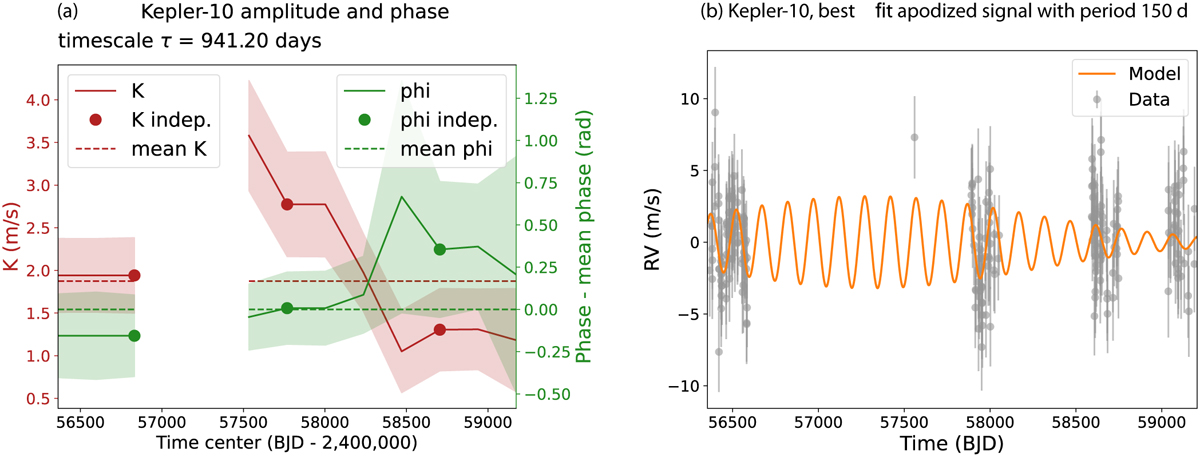
(a) Semiamplitude (red) and phase (green) of the 150 d signal averaged over a window of size [t0−τ, t0+τ] where τ = Tobs/3, and Tobs is the total observation timespan. The solid lines represent the least square fit, and the shaded areas the ± 1σ intervals. Red and green dotted lines represent the mean value of the amplitude and phase, respectively. (b) In grey, HARPS-N data processed with YARARA-v2; in orange, a model of the form ![]() , where ω, A, B, τ, and t0 are adjusted starting from ω = 2 π/150 rad/ day.
, where ω, A, B, τ, and t0 are adjusted starting from ω = 2 π/150 rad/ day.
Current usage metrics show cumulative count of Article Views (full-text article views including HTML views, PDF and ePub downloads, according to the available data) and Abstracts Views on Vision4Press platform.
Data correspond to usage on the plateform after 2015. The current usage metrics is available 48-96 hours after online publication and is updated daily on week days.
Initial download of the metrics may take a while.