Fig. A.1
Download original image
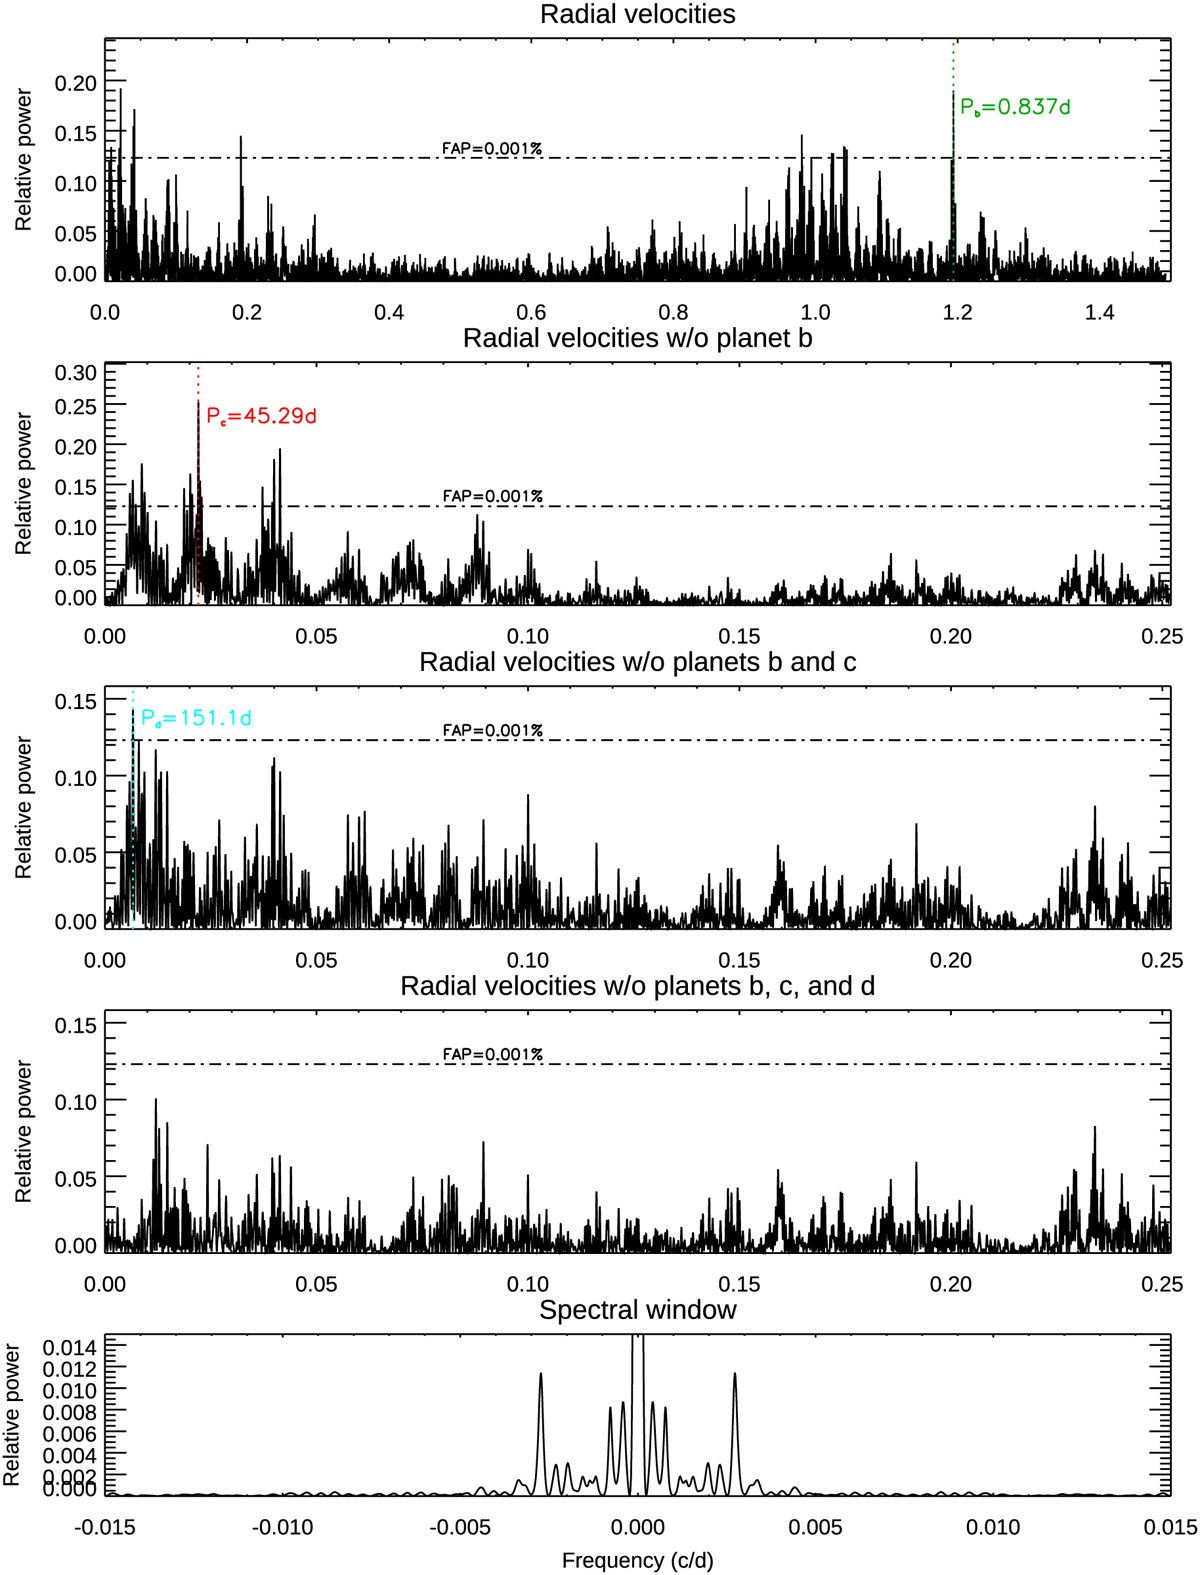
Generalized Lomb-Scargle periodograms of the 291 HARPS-N radial velocities and residuals as a function of frequency in cycles/day (or day−1). From top to bottom are displayed the periodograms of radial velocities; residuals after subtracting the signal of Kepler-10 b; residuals after subtracting the signals of both Kepler-10 b and c; residuals after subtracting the signals of Kepler-10 b, c, and d; and the spectral window. The dotted vertical lines indicate the orbital periods of planets b (green), c (red), and d (light blue). The horizontal dash-dotted lines show the false alarm probability level of 10−5.
Current usage metrics show cumulative count of Article Views (full-text article views including HTML views, PDF and ePub downloads, according to the available data) and Abstracts Views on Vision4Press platform.
Data correspond to usage on the plateform after 2015. The current usage metrics is available 48-96 hours after online publication and is updated daily on week days.
Initial download of the metrics may take a while.