Fig. 5
Download original image
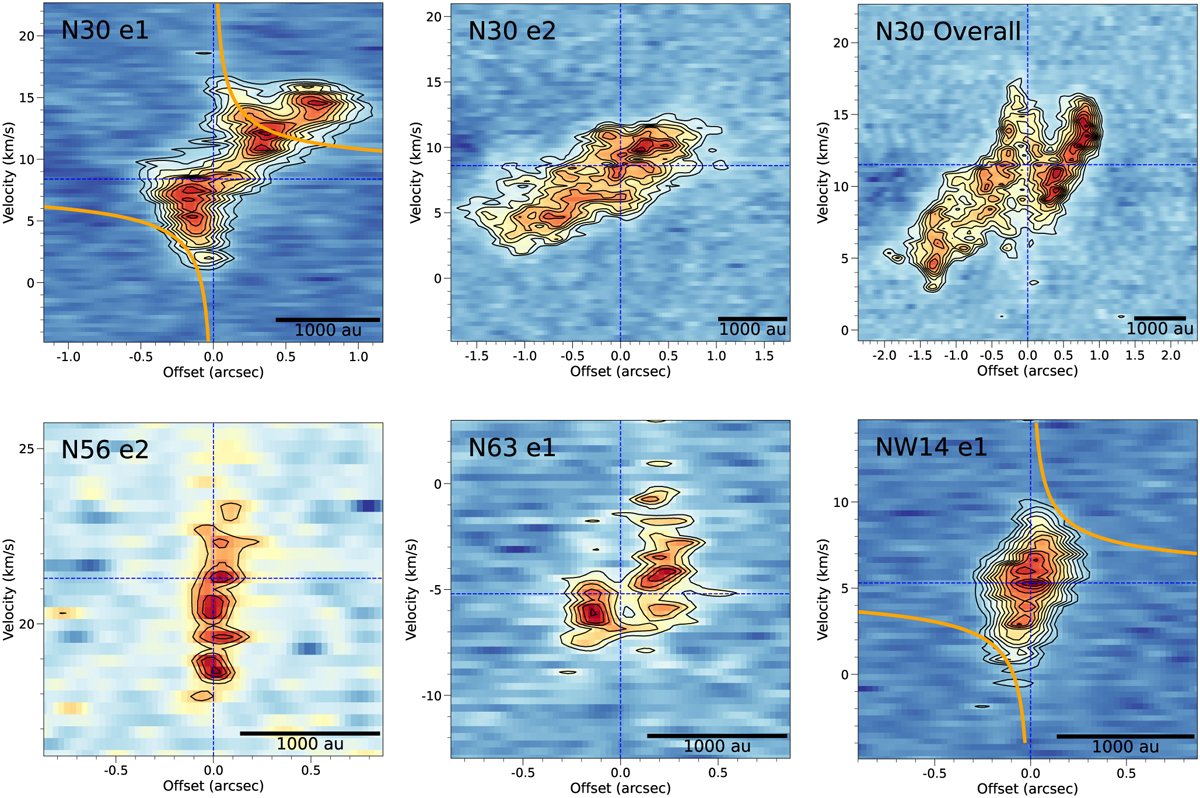
PV diagram of the CH3CN (123 − 113) line across the observed fragments. The cuts are made along the dashed black lines indicated in Fig. 3. The width of the cut is the size of a synthesized beam (~0.18″) and the reference position is the center of the corresponding fragment. Top left of each panel labels the name of the fragment. “N30 overall” indicates the PV plot centered at N30 e5 was cut along the northwest-southeast direction across the triple system in N30, as mentioned in Section 4.1. The black contours start from 6σ and increase in steps of 3σ. The orange solid lines show the Keplerian profile corresponding to the mass estimates listed in Table 3. The vertical line marks the center of the corresponding fragment. The horizontal line indicates the systemic velocity derived from the CH3CN line fitting of each fragment. The systematic velocity for “N30 Overall” is the fitting result of N30 e5.
Current usage metrics show cumulative count of Article Views (full-text article views including HTML views, PDF and ePub downloads, according to the available data) and Abstracts Views on Vision4Press platform.
Data correspond to usage on the plateform after 2015. The current usage metrics is available 48-96 hours after online publication and is updated daily on week days.
Initial download of the metrics may take a while.