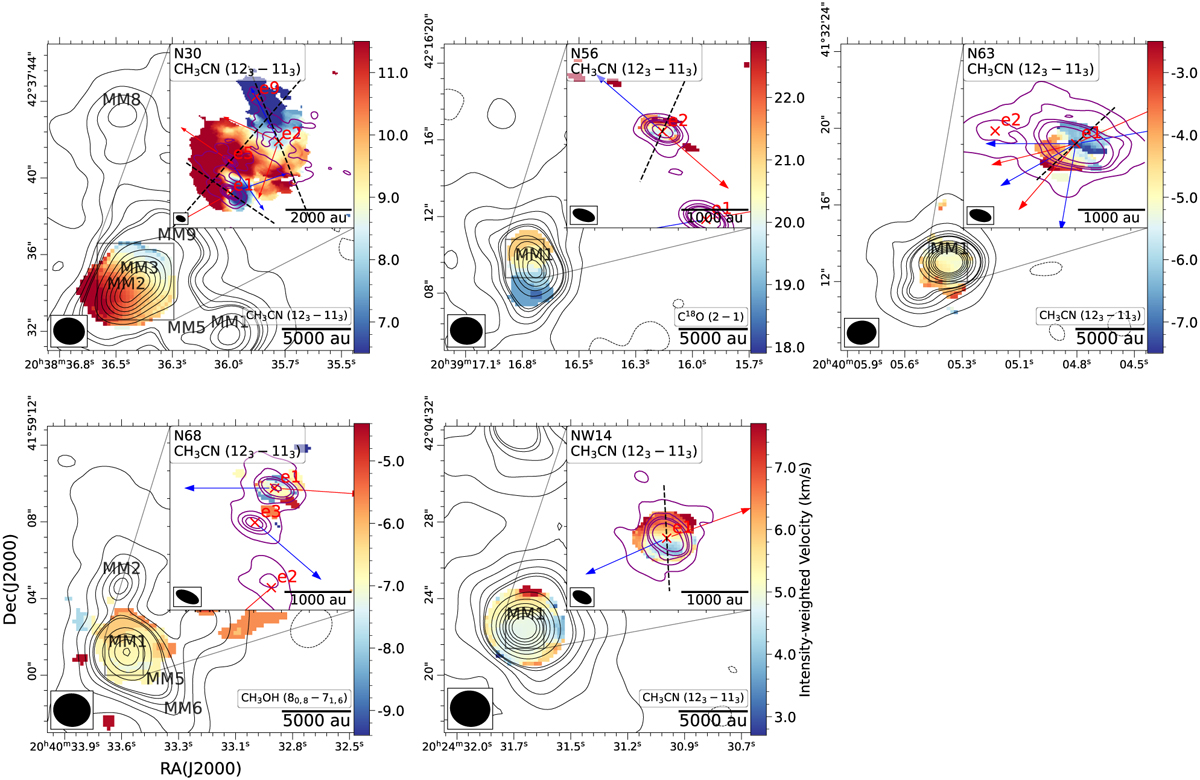
Fig. 3
Download original image
Zooming in on the velocity fields of each massive dense core. The main panel displays intensity-weighted mean velocity maps of the molecular line emission observed by SMA (see Fig. 3 in Pan et al. (2024)), with the SMA 1.3 mm continuum emission overlaid in contours. In the top-right corner of each panel, the velocity field of the CH3CN (123 − 113) line from the NOEMA observations is shown, overlaid with the NOEMA 1.3 mm continuum emission in contours, as in Fig. 2. The blue and red arrows starting from the center of the fragments indicate the blueshifted and redshifted CO outflow axes, staring from the center of the corresponding fragment, respectively. The dashed black lines mark the orientations of the PV cuts shown in Fig. 5. The ellipses at the bottom-left corner of each image shows the synthesized beam for the corresponding observation.
Current usage metrics show cumulative count of Article Views (full-text article views including HTML views, PDF and ePub downloads, according to the available data) and Abstracts Views on Vision4Press platform.
Data correspond to usage on the plateform after 2015. The current usage metrics is available 48-96 hours after online publication and is updated daily on week days.
Initial download of the metrics may take a while.