Fig. 2
Download original image
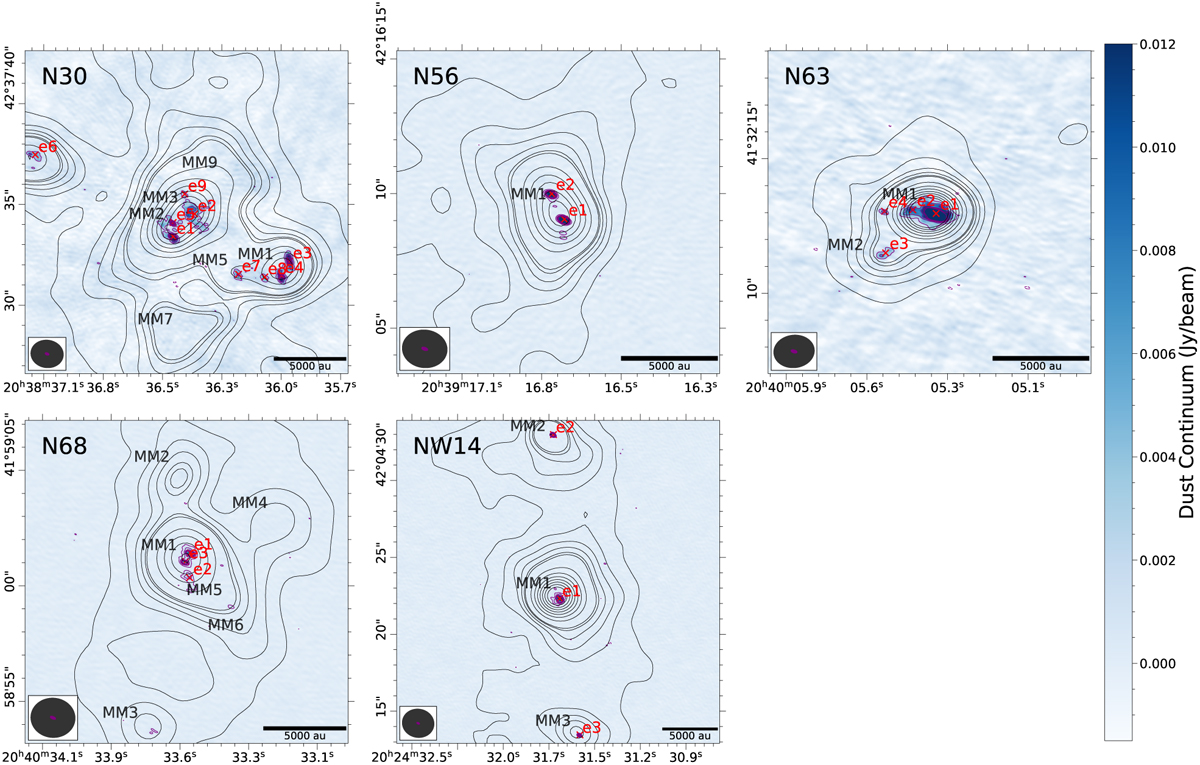
1.3 mm continuum images for sources in our sample obtained with NOEMA. The purple contours start from 4σ and increase in steps of 6σ. The red crosses represent the position of fragments identified by Dendrogram. We also overlay the low-resolution (~1.8″) SMA 1.3 mm continuum emission in black contours. The black labels starting with MM indicate the 2000 au scale condensations identified with the SMA observations in Pan et al. (2024). The synthesized beam of each image is shown in the bottom left. The purple and black ellipses indicates the beam size of the NOEMA and SMA observations, respectively.
Current usage metrics show cumulative count of Article Views (full-text article views including HTML views, PDF and ePub downloads, according to the available data) and Abstracts Views on Vision4Press platform.
Data correspond to usage on the plateform after 2015. The current usage metrics is available 48-96 hours after online publication and is updated daily on week days.
Initial download of the metrics may take a while.