Fig. 9.
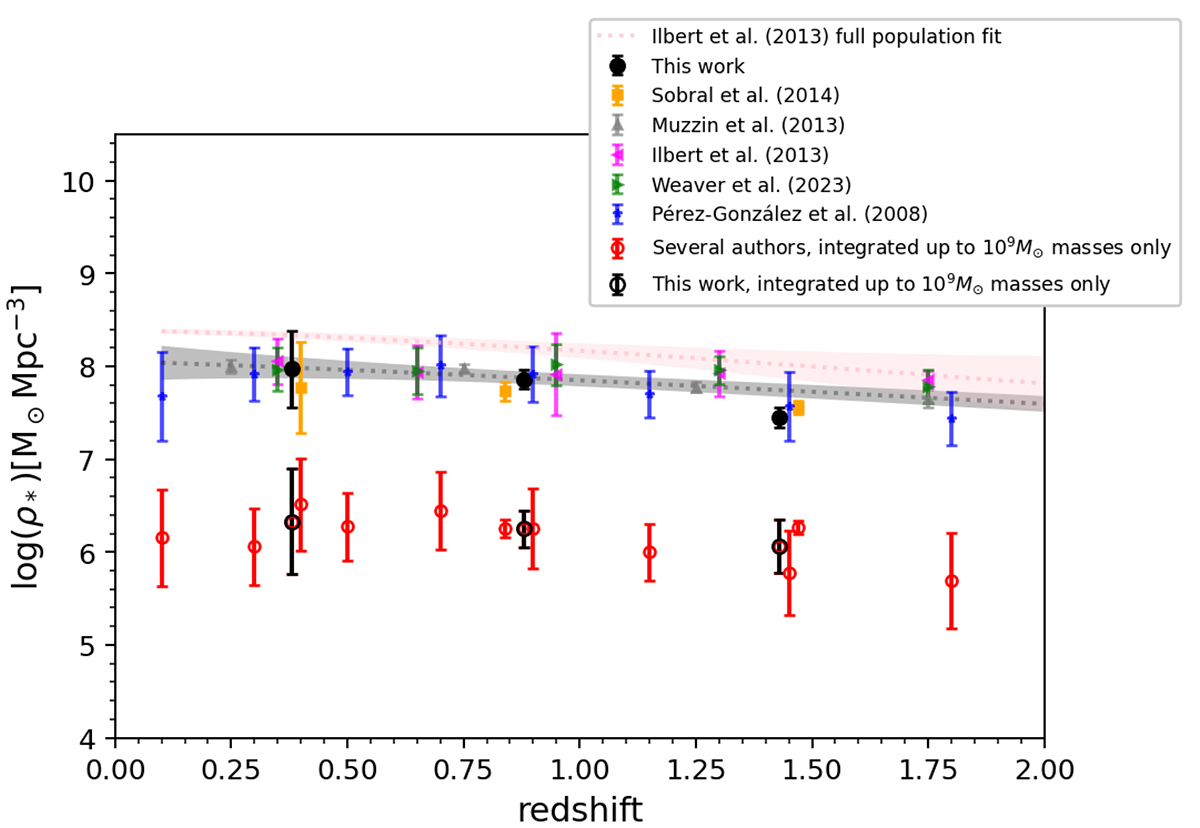
Download original image
Logarithm of ρ* in solar masses per cubic megaparsec for the SFGs as a function of redshift up to z = 2. The filled black circles are our results from the integration of the SMFs for all masses. The open black circles are the same, but integrated only up to log(M*[M⊙]) = 9, in order to sample only the low-mass galaxy regime. The dotted lines represent the parametric fit by Ilbert et al. (2013). The pink one is the fit for the full population of galaxies (ELGs and quiescent) of Ilbert et al. (2013), and the grey one is the fit for all ELGs from the authors indicated in the legend. Shaded areas were calculated as is indicated in Fig. 4. The open red circles represent data from Sobral et al. (2014) and Pérez-González et al. (2008). The remaining symbols and colour coding are reported in the legend.
Current usage metrics show cumulative count of Article Views (full-text article views including HTML views, PDF and ePub downloads, according to the available data) and Abstracts Views on Vision4Press platform.
Data correspond to usage on the plateform after 2015. The current usage metrics is available 48-96 hours after online publication and is updated daily on week days.
Initial download of the metrics may take a while.