Fig. 4.
Download original image
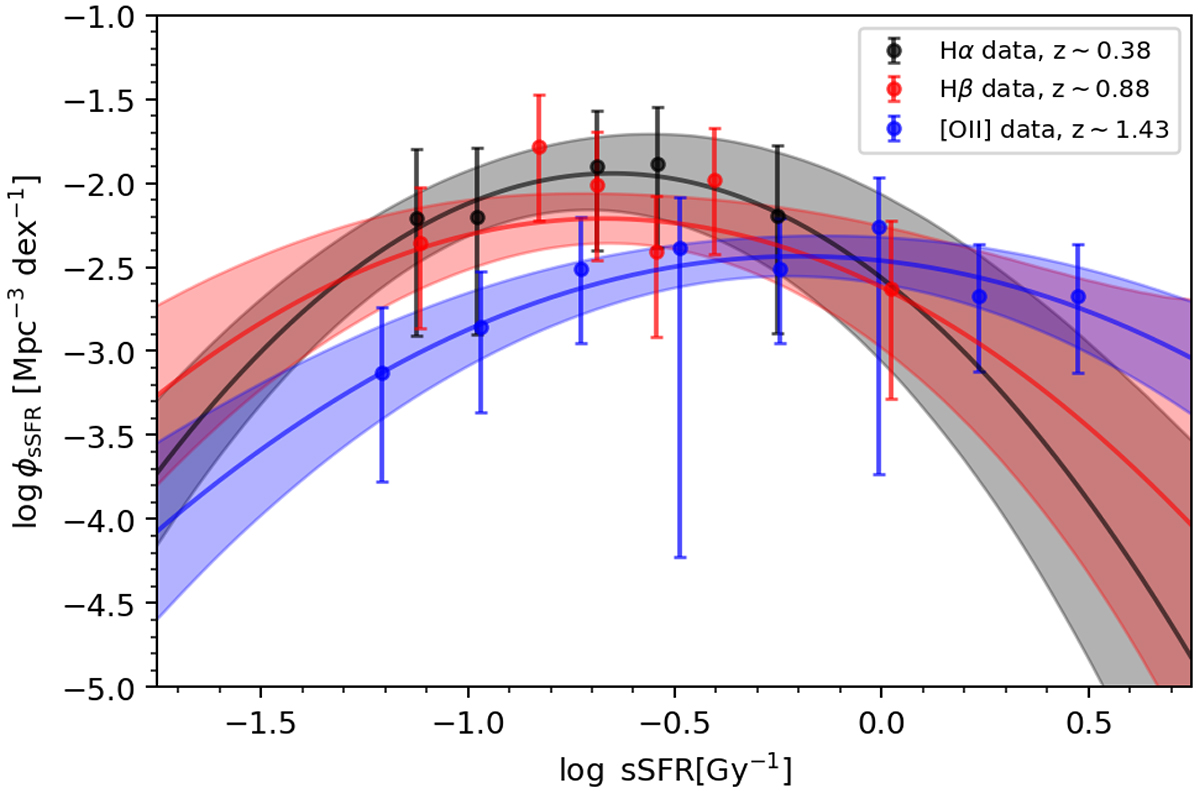
sSFRF of the Hα (black dots), Hβ (red dots), and [O II] (blue dots) from the OTELO survey. The solid lines represent the log-normal fitting functions for each line (black for Hα, red for Hβ, and blue for [O II]), following Ilbert et al. (2015)’s recipe. The shaded areas represent the propagation of 1σ uncertainties of the tabulated fits after 105 Monte Carlo simulations.
Current usage metrics show cumulative count of Article Views (full-text article views including HTML views, PDF and ePub downloads, according to the available data) and Abstracts Views on Vision4Press platform.
Data correspond to usage on the plateform after 2015. The current usage metrics is available 48-96 hours after online publication and is updated daily on week days.
Initial download of the metrics may take a while.