Fig. 7.
Download original image
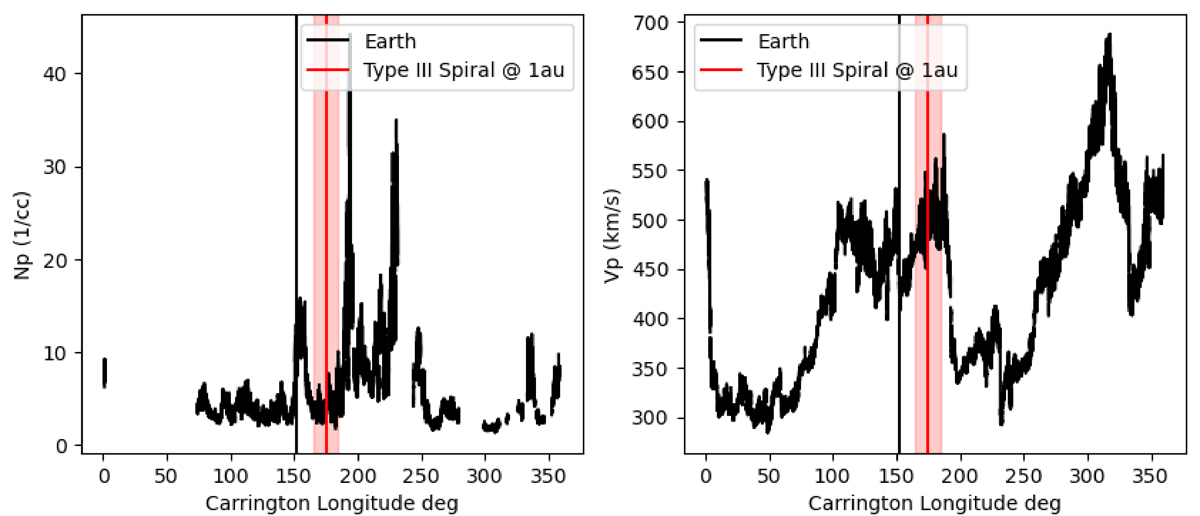
In situ data obtained by ACE. Left: Proton density. Right: Measured velocity of the solar wind. Black vertical lines correspond to the location of the spacecraft along the Carrington longitude on the date of the event. The red vertical lines correspond to the measurements made when the spacecraft is at the Carrington longitude as determined by the BELLA-derived Parker spiral at 1 au. The red-shaded region corresponds to a ±10° around the red line to account for in situ measurement variability. Our measurements show a proton density of 4 ± 2.3 1/cc and a solar wind velocity of 500 ± 70 km s−1.
Current usage metrics show cumulative count of Article Views (full-text article views including HTML views, PDF and ePub downloads, according to the available data) and Abstracts Views on Vision4Press platform.
Data correspond to usage on the plateform after 2015. The current usage metrics is available 48-96 hours after online publication and is updated daily on week days.
Initial download of the metrics may take a while.