Fig. 5
Download original image
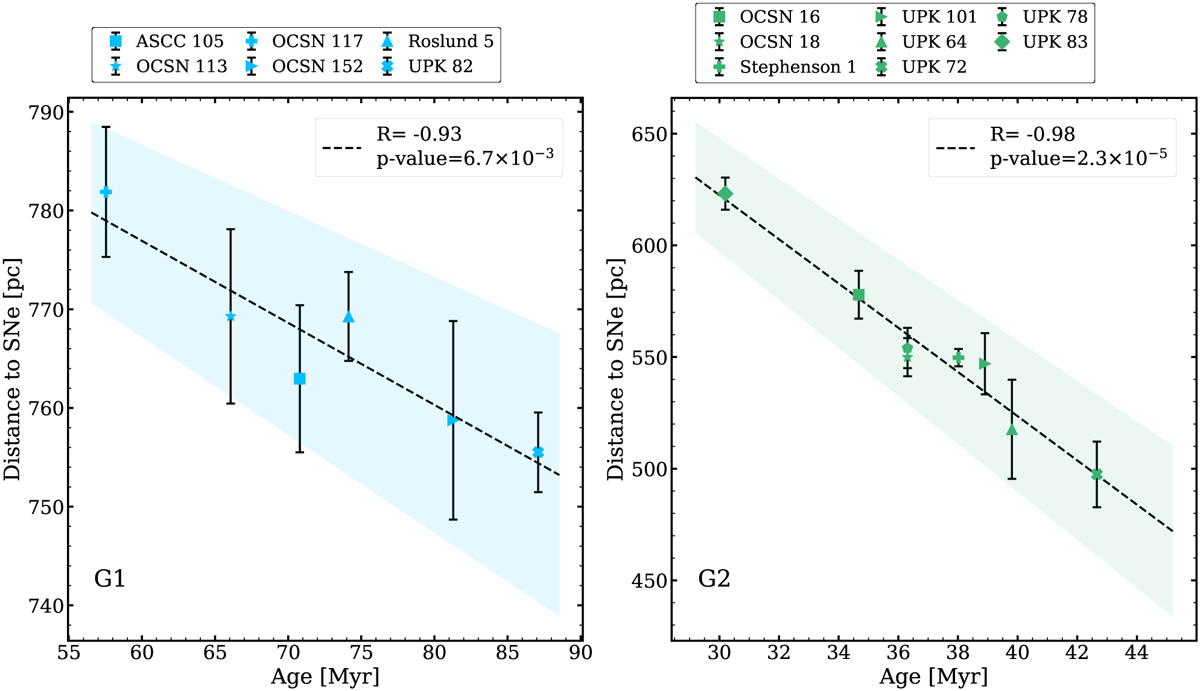
OC ages as a function of the separation to the most probable SN explosion sites. The black dash lines represent the best-fitted linear relation. The left panel shows the result for G1, while the right panel displays the result for G2. The shaded area represents the range of the standard error for the estimated slope. Error bars are computed using error propagation, based on the standard error of the spatial distribution of the member stars.
Current usage metrics show cumulative count of Article Views (full-text article views including HTML views, PDF and ePub downloads, according to the available data) and Abstracts Views on Vision4Press platform.
Data correspond to usage on the plateform after 2015. The current usage metrics is available 48-96 hours after online publication and is updated daily on week days.
Initial download of the metrics may take a while.