Open Access
Fig. 4
Download original image
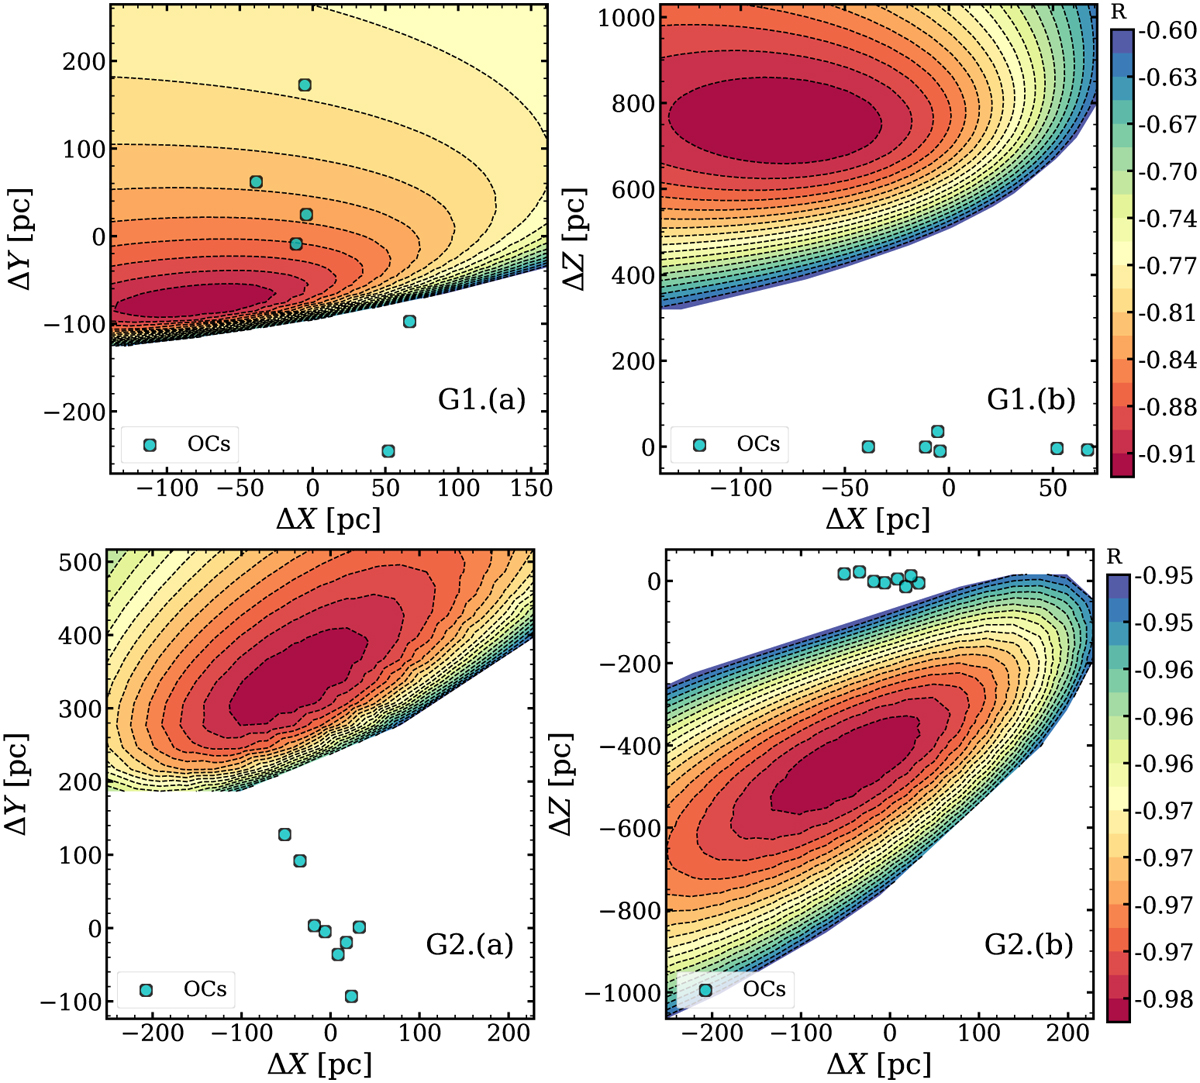
Relative 3D spatial distribution of potential SN explosion regions. The cyan dots represent the relative distribution of member OCs at the birth time of the oldest clusters within each OC group. The contour colors represent levels of the correlation coefficient, as shown in the color bar.
Current usage metrics show cumulative count of Article Views (full-text article views including HTML views, PDF and ePub downloads, according to the available data) and Abstracts Views on Vision4Press platform.
Data correspond to usage on the plateform after 2015. The current usage metrics is available 48-96 hours after online publication and is updated daily on week days.
Initial download of the metrics may take a while.