Fig. 3
Download original image
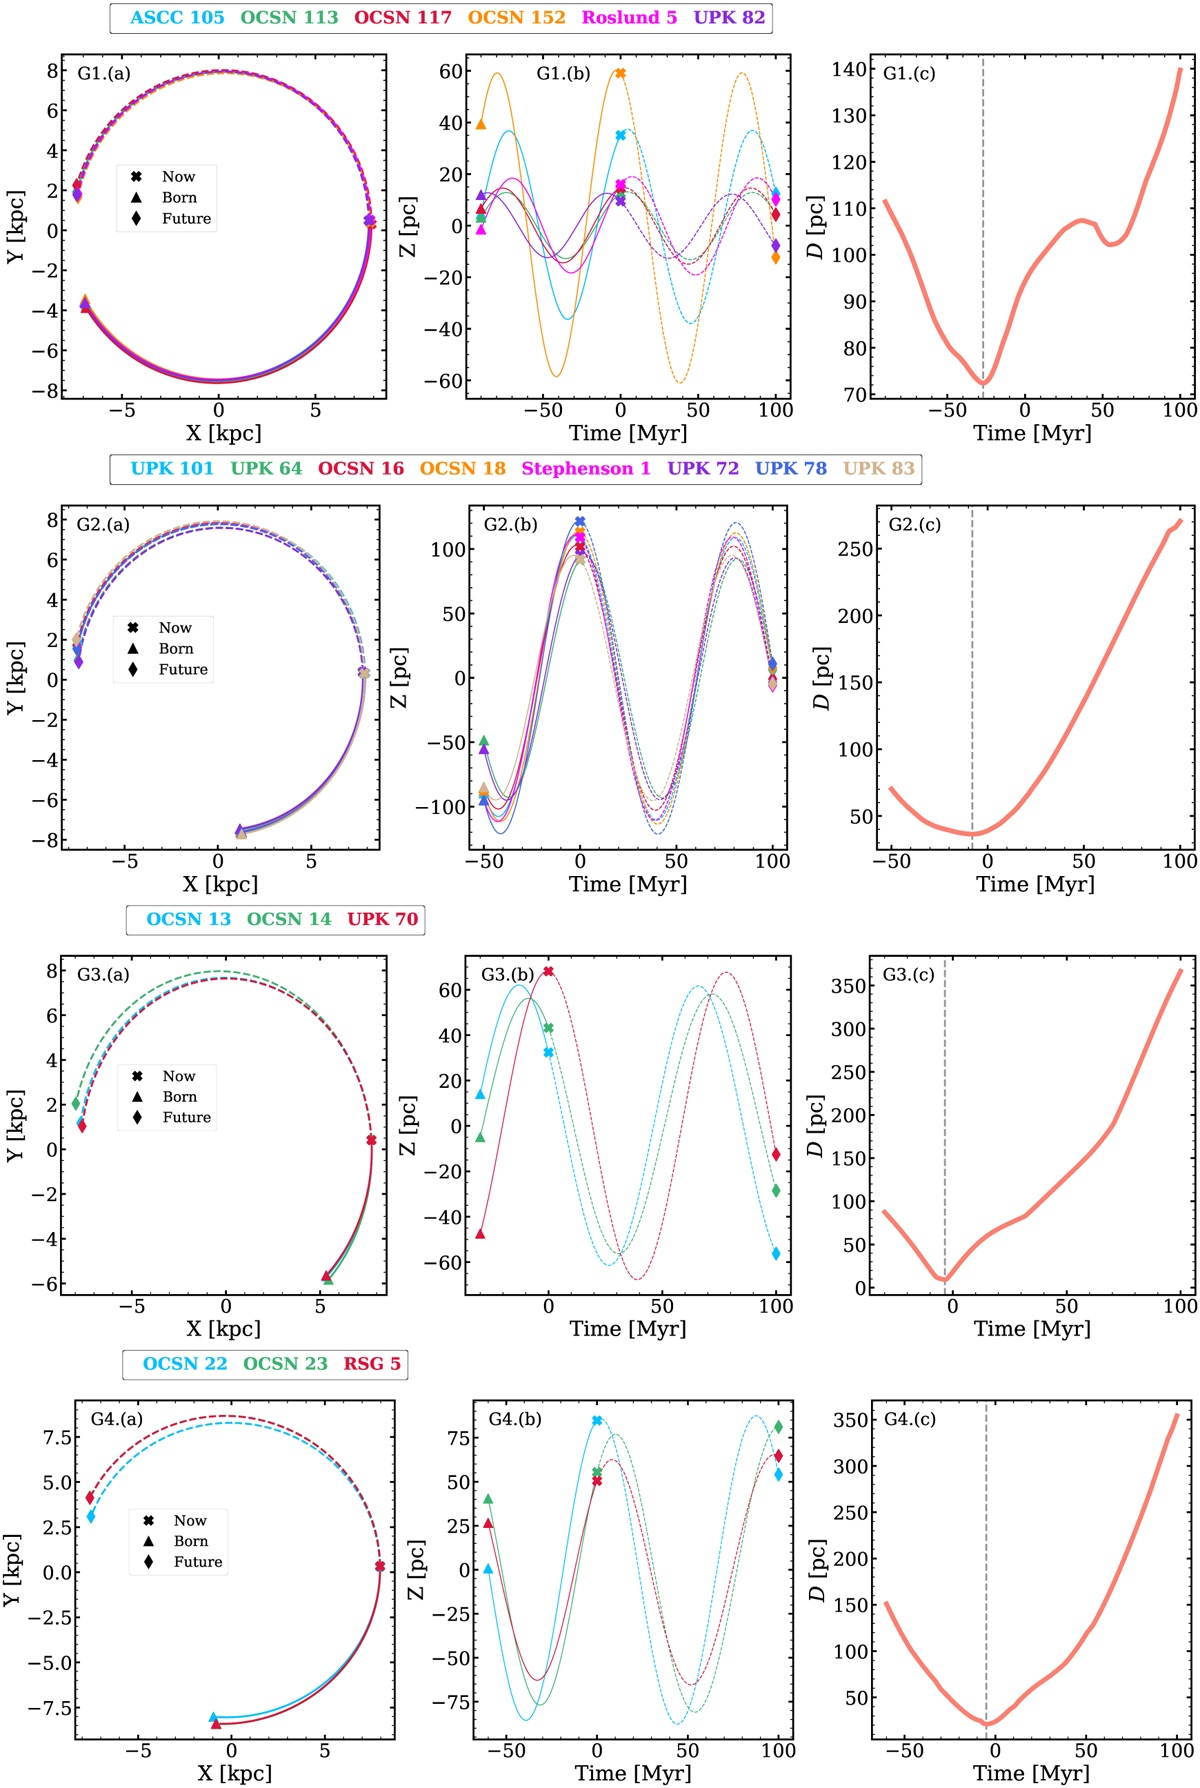
Orbital integration and mean separation between member OCs and the OC group center over time. Panels a–b: orbital trajectories in the X−Y and in Z-coordinate over time. Colors are used to distinguish different OCs. Cross symbols mark the present-day locations, triangles represent the past positions of each OC at the birth time of the oldest OC, and diamond symbols denote the predicted positions in 100 Myr. Panel c: the vertical dashed line marks the moment when the separation reaches a minimum.
Current usage metrics show cumulative count of Article Views (full-text article views including HTML views, PDF and ePub downloads, according to the available data) and Abstracts Views on Vision4Press platform.
Data correspond to usage on the plateform after 2015. The current usage metrics is available 48-96 hours after online publication and is updated daily on week days.
Initial download of the metrics may take a while.