Fig. 2
Download original image
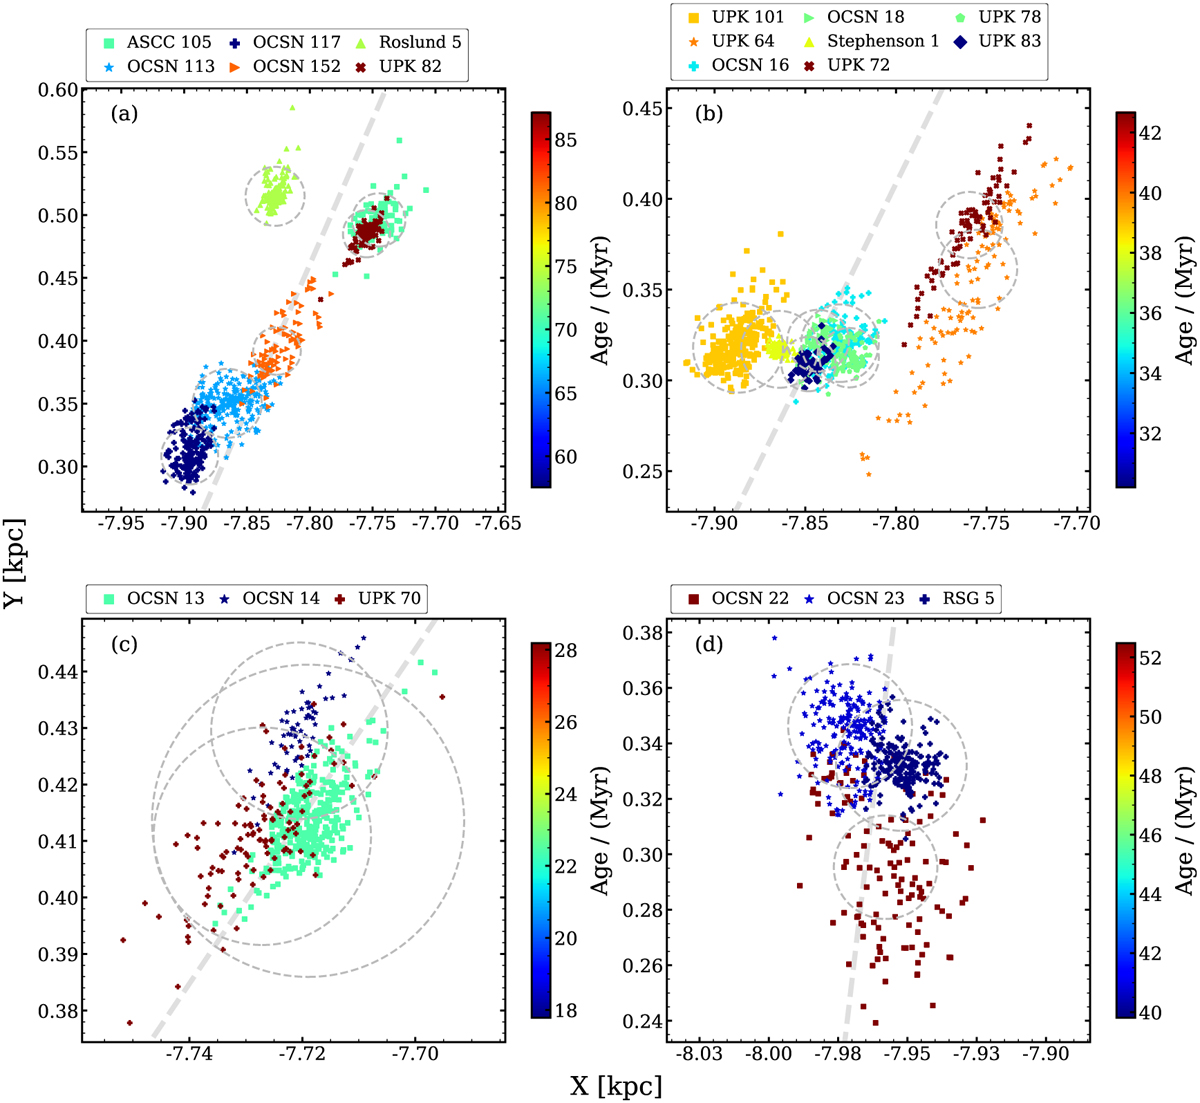
Spatial distribution of OC groups after distance correction. Panels (a) G1, (b) G2, (c) G3, and (d) G4 depict the different groups, with symbols representing member stars of the various OCs (color-coded with age as represented in the color bar). The gray dashed lines indicate the lines of sight, while the gray dashed circles represent the locations of 3rt for each cluster.
Current usage metrics show cumulative count of Article Views (full-text article views including HTML views, PDF and ePub downloads, according to the available data) and Abstracts Views on Vision4Press platform.
Data correspond to usage on the plateform after 2015. The current usage metrics is available 48-96 hours after online publication and is updated daily on week days.
Initial download of the metrics may take a while.