Fig. 4
Download original image
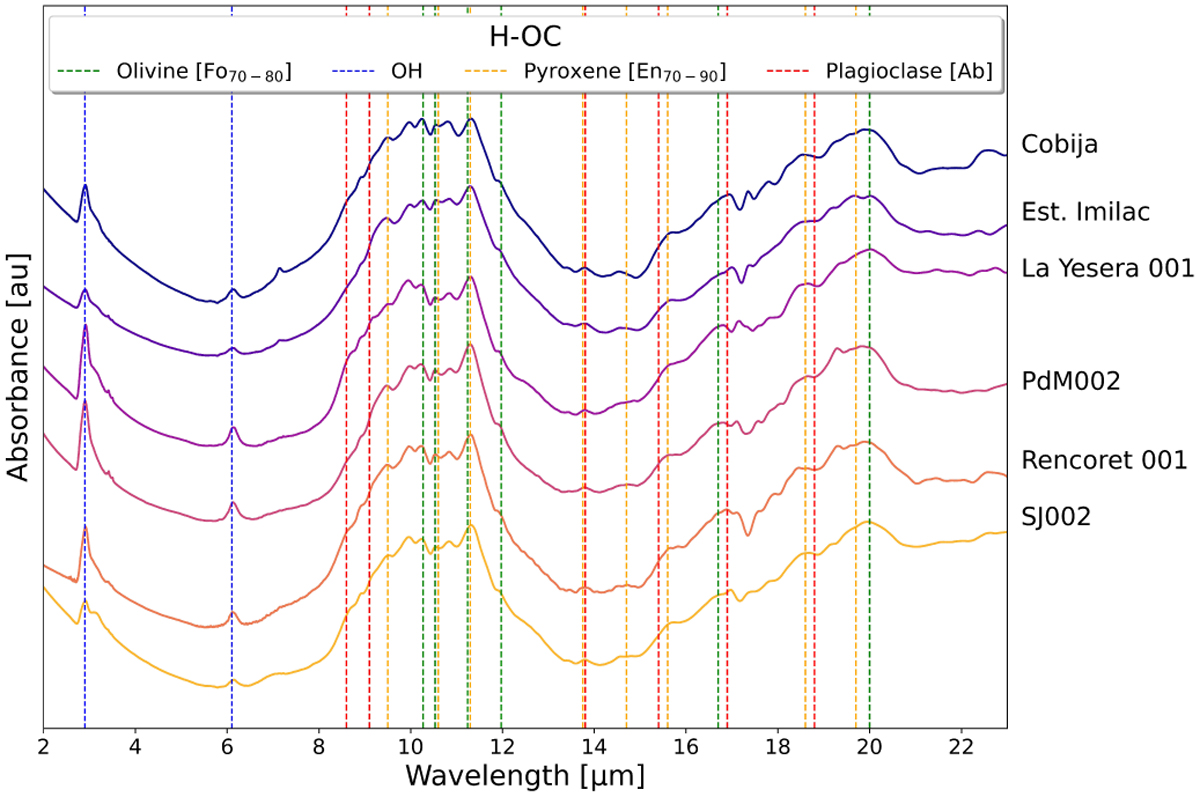
Mid-infrared spectra of H-OC. The spectra correspond to milled samples, with grain size between 1–10 μm. The data presented are normalized to the maximum in the range of 8–12 μm and vertically shifted for a better appreciation of shape and peaks. The vertical lines correspond to characteristic absorption bands of different minerals: light blue, for the water bands (OH); green for olivine bands, orange for the pyroxene bands, and red for plagioclase (Chihara et al. 2002; Koike et al. 2003b; Beck et al. 2014; Chihara & Koike 2017).
Current usage metrics show cumulative count of Article Views (full-text article views including HTML views, PDF and ePub downloads, according to the available data) and Abstracts Views on Vision4Press platform.
Data correspond to usage on the plateform after 2015. The current usage metrics is available 48-96 hours after online publication and is updated daily on week days.
Initial download of the metrics may take a while.