Open Access
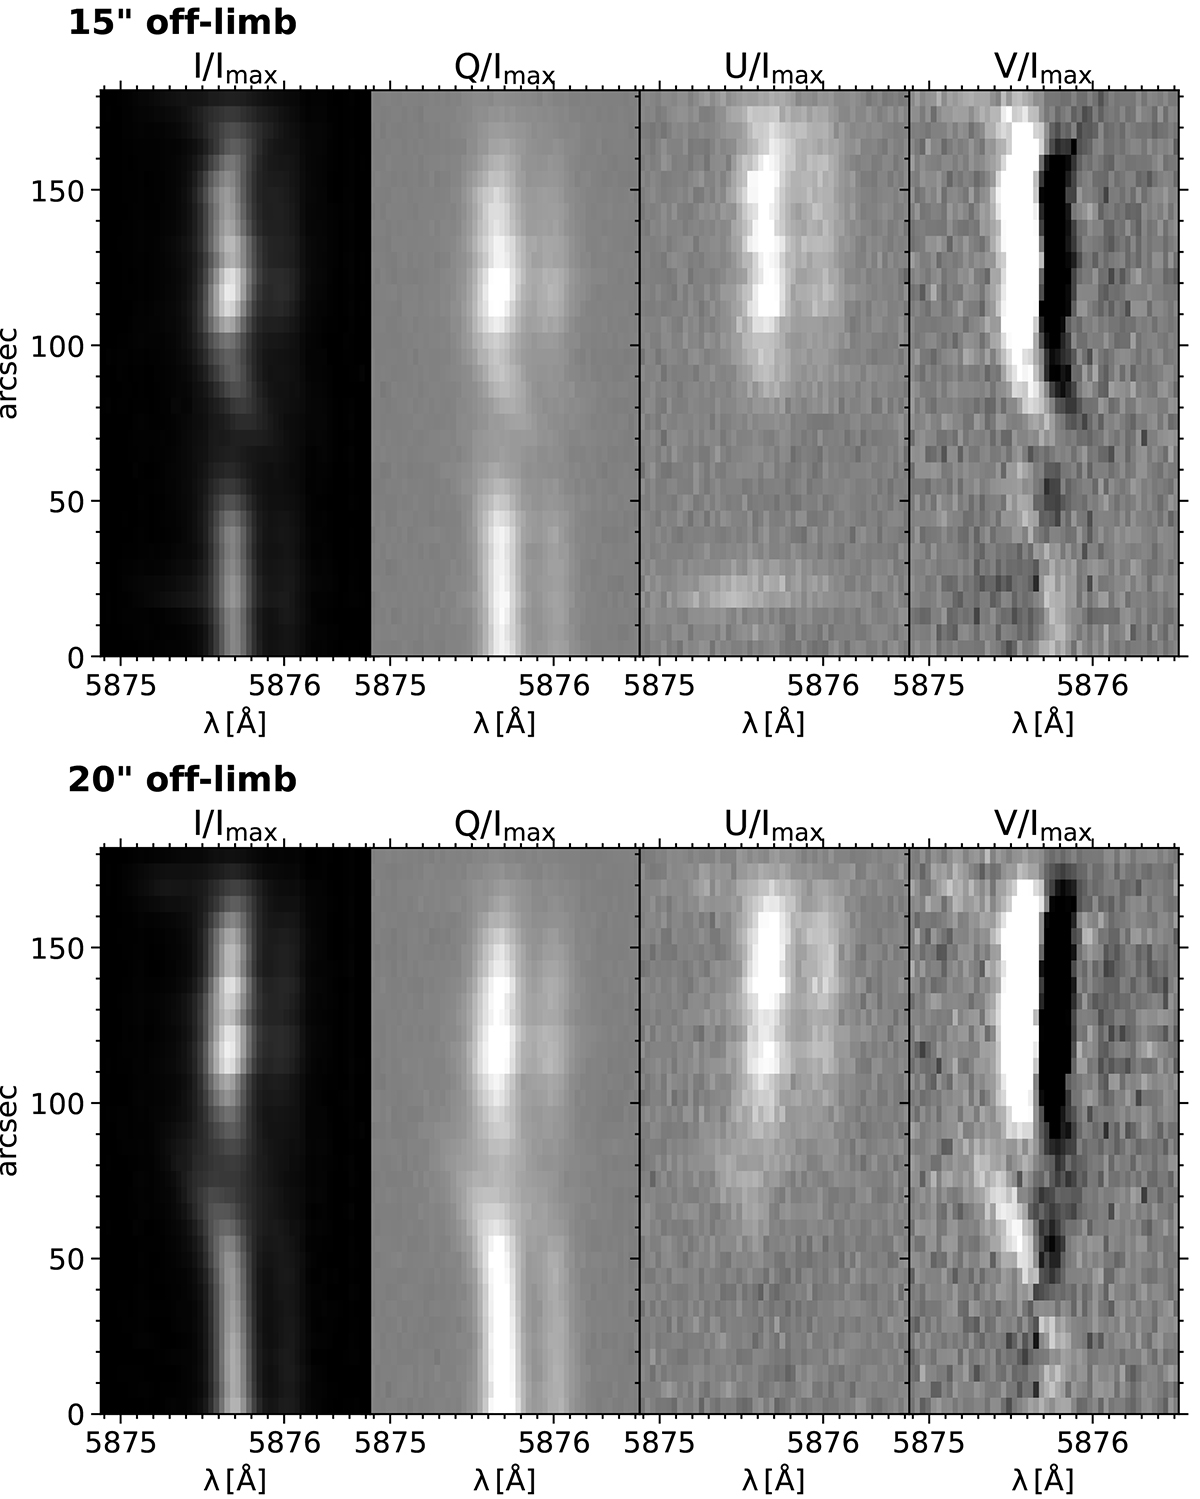
Fig. 7.
Download original image
Stokes profiles along the slits located at 15″ and 20″ from the solar limb. The ranges used for color saturation in the I/Imax, Q/Imax, U/Imax, and V/Imax panels are [0, 1], [–8 × 10⁻³, 8 × 10⁻³], [–2 × 10⁻³, 2 × 10⁻³], and [–8 × 10⁻⁴, 8 × 10⁻⁴], respectively. Imax stands for the maximum intensity signal along each slit.
Current usage metrics show cumulative count of Article Views (full-text article views including HTML views, PDF and ePub downloads, according to the available data) and Abstracts Views on Vision4Press platform.
Data correspond to usage on the plateform after 2015. The current usage metrics is available 48-96 hours after online publication and is updated daily on week days.
Initial download of the metrics may take a while.