Fig. 4.
Download original image
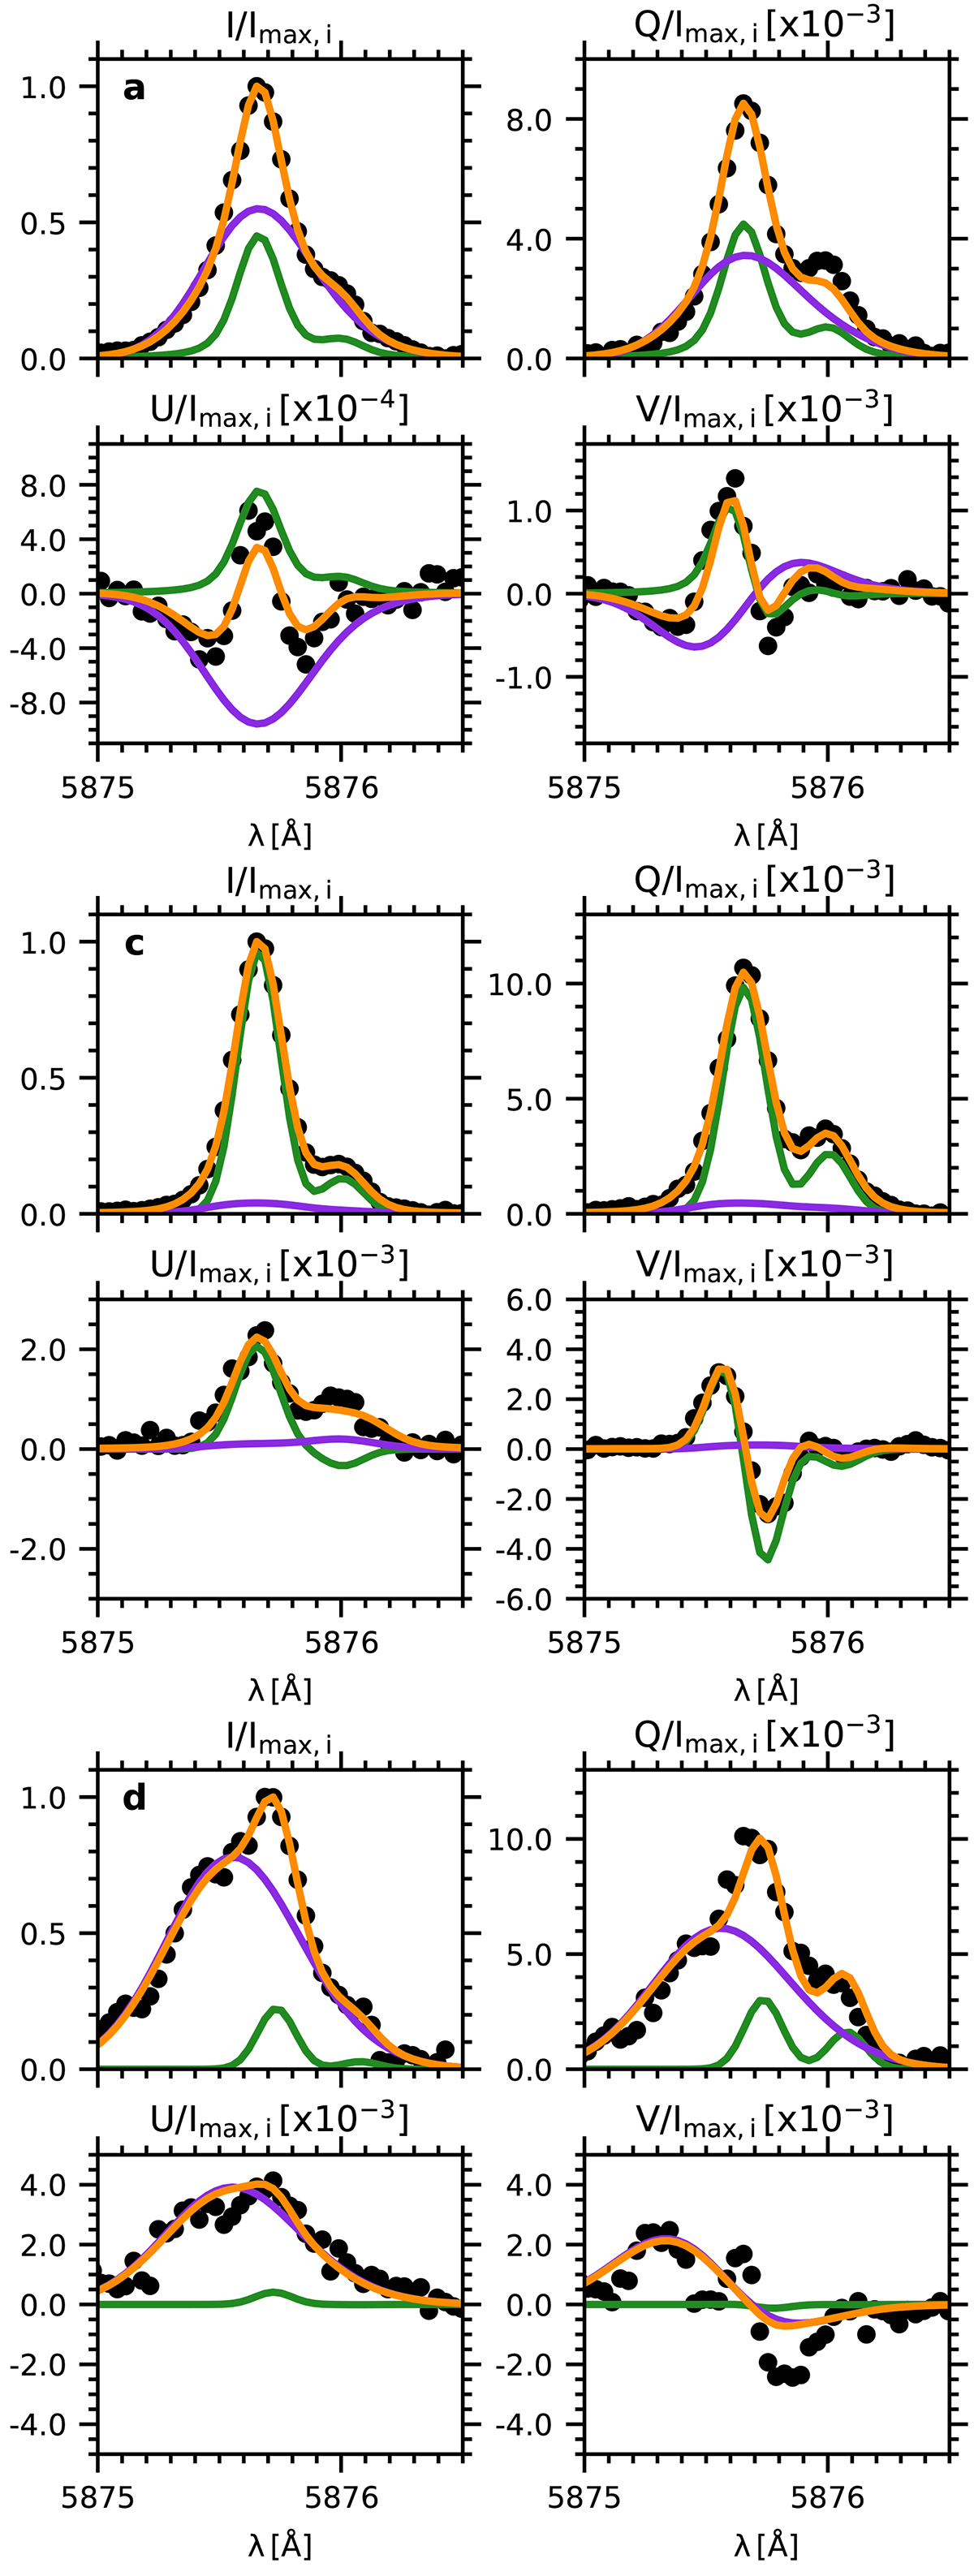
Synthetic profiles resulting from the two atmospheric components (green and violet, respectively) assumed in the inversion of the Stokes profiles labeled a, c, and d in Fig. 3. The observed and best-fit profiles are shown, respectively, in black (dotted curves) and orange. Imax, i stands for the maximum intensity signal of the plotted pixel.
Current usage metrics show cumulative count of Article Views (full-text article views including HTML views, PDF and ePub downloads, according to the available data) and Abstracts Views on Vision4Press platform.
Data correspond to usage on the plateform after 2015. The current usage metrics is available 48-96 hours after online publication and is updated daily on week days.
Initial download of the metrics may take a while.