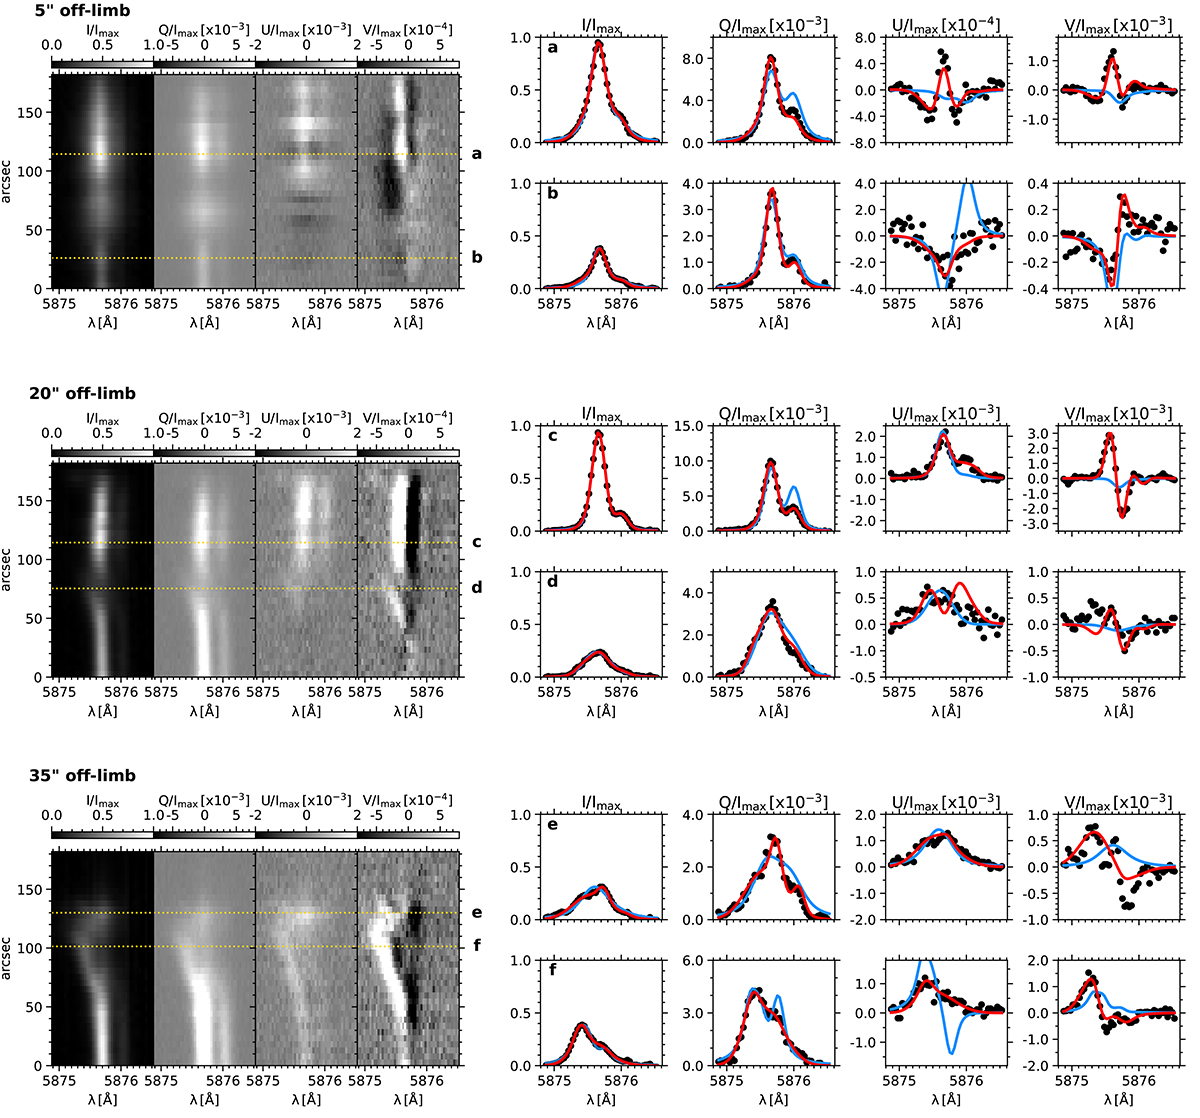
Fig. 3.
Download original image
Details of the spectropolarimetric data and synthetic profiles inferred from the inversions. Left: Spectra emerging along the slits located at 5″, 20″, and 35″ from the solar limb. Right: Stokes profiles at the positions labeled a–f and marked with dashed yellow lines on the left panels (dotted lines). The synthetic profiles obtained when assuming one and two magnetic components are represented by blue and red lines, respectively. Imax stands for the maximum intensity signal along each slit.
Current usage metrics show cumulative count of Article Views (full-text article views including HTML views, PDF and ePub downloads, according to the available data) and Abstracts Views on Vision4Press platform.
Data correspond to usage on the plateform after 2015. The current usage metrics is available 48-96 hours after online publication and is updated daily on week days.
Initial download of the metrics may take a while.