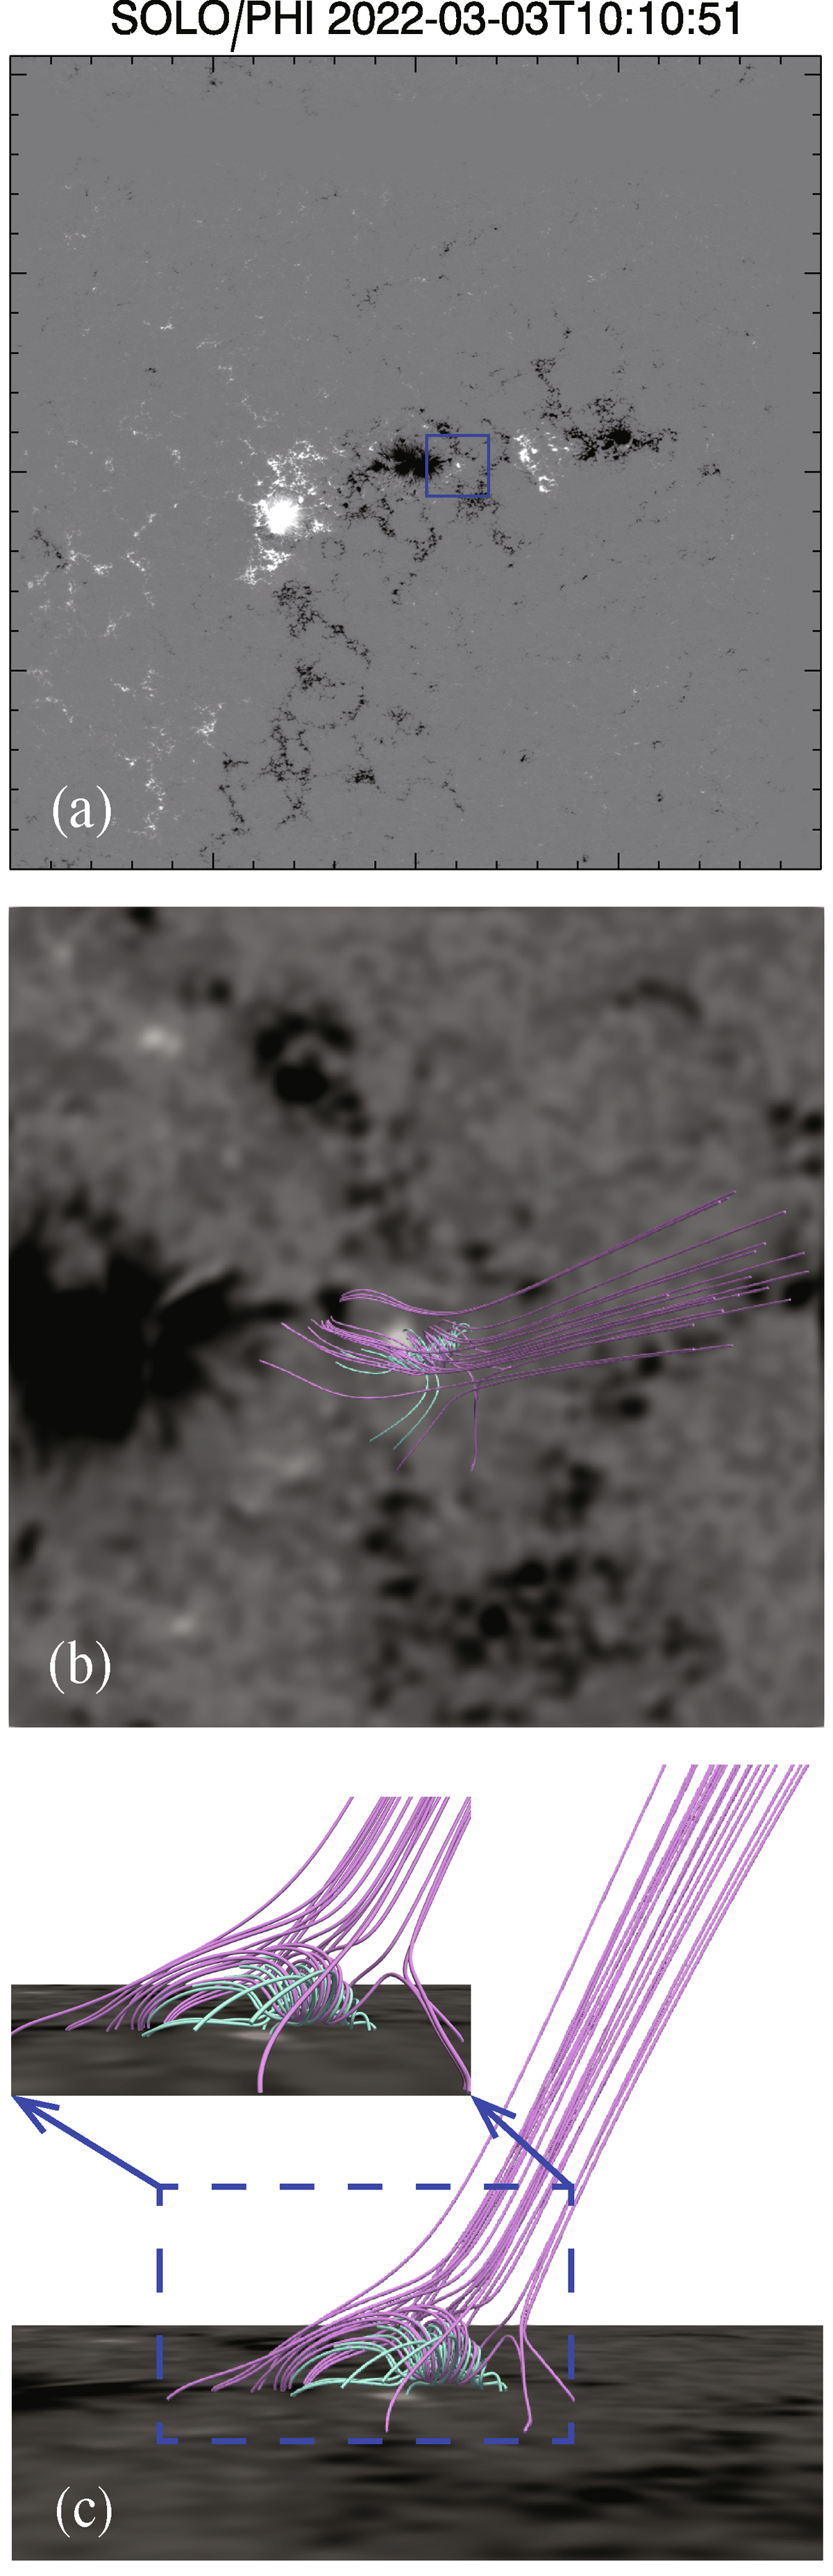
Fig. B.1.
Download original image
Overview of the surface magnetic field. (a) PHI line-of-sight (LOS) magnetogram showing the magnetic field distribution of the associated main active region before the eruption. (b) 3D magnetic field configuration, traced by the magnetic field lines, showing the initial condition of data-constrained 3D MHD simulation. The background image is the zoom-in of the PHI LOS magnetogram, as marked by a blue square in panel (a). (c) Same as panel (b), but for the side view and with a small panel more clearly showing the flux rope.
Current usage metrics show cumulative count of Article Views (full-text article views including HTML views, PDF and ePub downloads, according to the available data) and Abstracts Views on Vision4Press platform.
Data correspond to usage on the plateform after 2015. The current usage metrics is available 48-96 hours after online publication and is updated daily on week days.
Initial download of the metrics may take a while.