Fig. 3.
Download original image
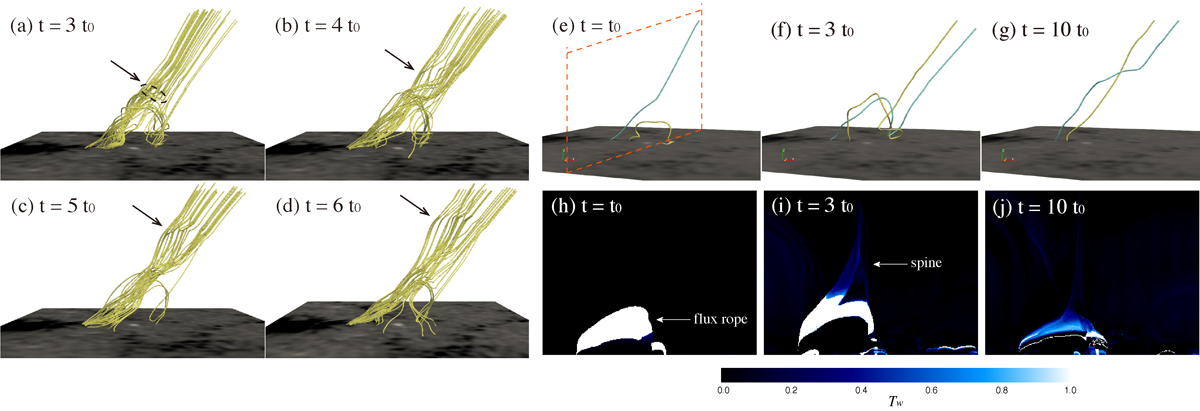
Twist transfer and propagation after the reconnection. (a)–(d): Evolution of magnetic field lines near the outer spine. The arrows point to the curvatures of the traced field lines. The ellipses in panel g indicate the plane to calculate the averaged mass flux in Fig. C.2. (e)–(g): Evolution of the representative field line around the outer spine (blue) and the representative flux rope field line (yellow). (h)–(j): Evolution of the distribution of the twist number measured in turns in y − z plane outlined in panel a.
Current usage metrics show cumulative count of Article Views (full-text article views including HTML views, PDF and ePub downloads, according to the available data) and Abstracts Views on Vision4Press platform.
Data correspond to usage on the plateform after 2015. The current usage metrics is available 48-96 hours after online publication and is updated daily on week days.
Initial download of the metrics may take a while.