Fig. 2.
Download original image
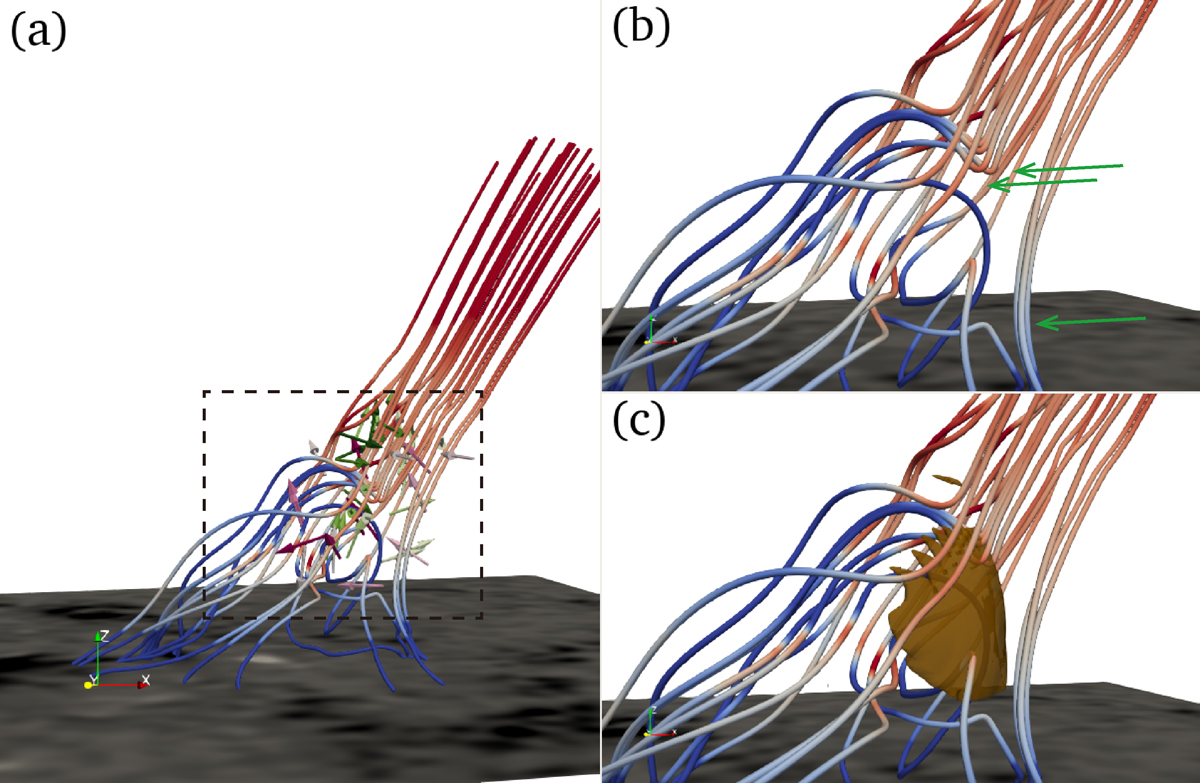
3D configuration of external reconnection in our simulation at t = 3t0. (a) Overview of magnetic field lines with the velocity vectors denoted by the arrows. The colors green and pink represent the positive and negative of vx, respectively. The colors of field lines have the same meaning as in Fig. 1. (b) Zoomed-in image of the reconnection region. The green arrows indicate magnetic dips. These heated curved field lines are formed through interchange reconnection between the erupting flux rope and the overlying open fields. (c) Same region as in panel b, but with the 3D curved current sheet.
Current usage metrics show cumulative count of Article Views (full-text article views including HTML views, PDF and ePub downloads, according to the available data) and Abstracts Views on Vision4Press platform.
Data correspond to usage on the plateform after 2015. The current usage metrics is available 48-96 hours after online publication and is updated daily on week days.
Initial download of the metrics may take a while.