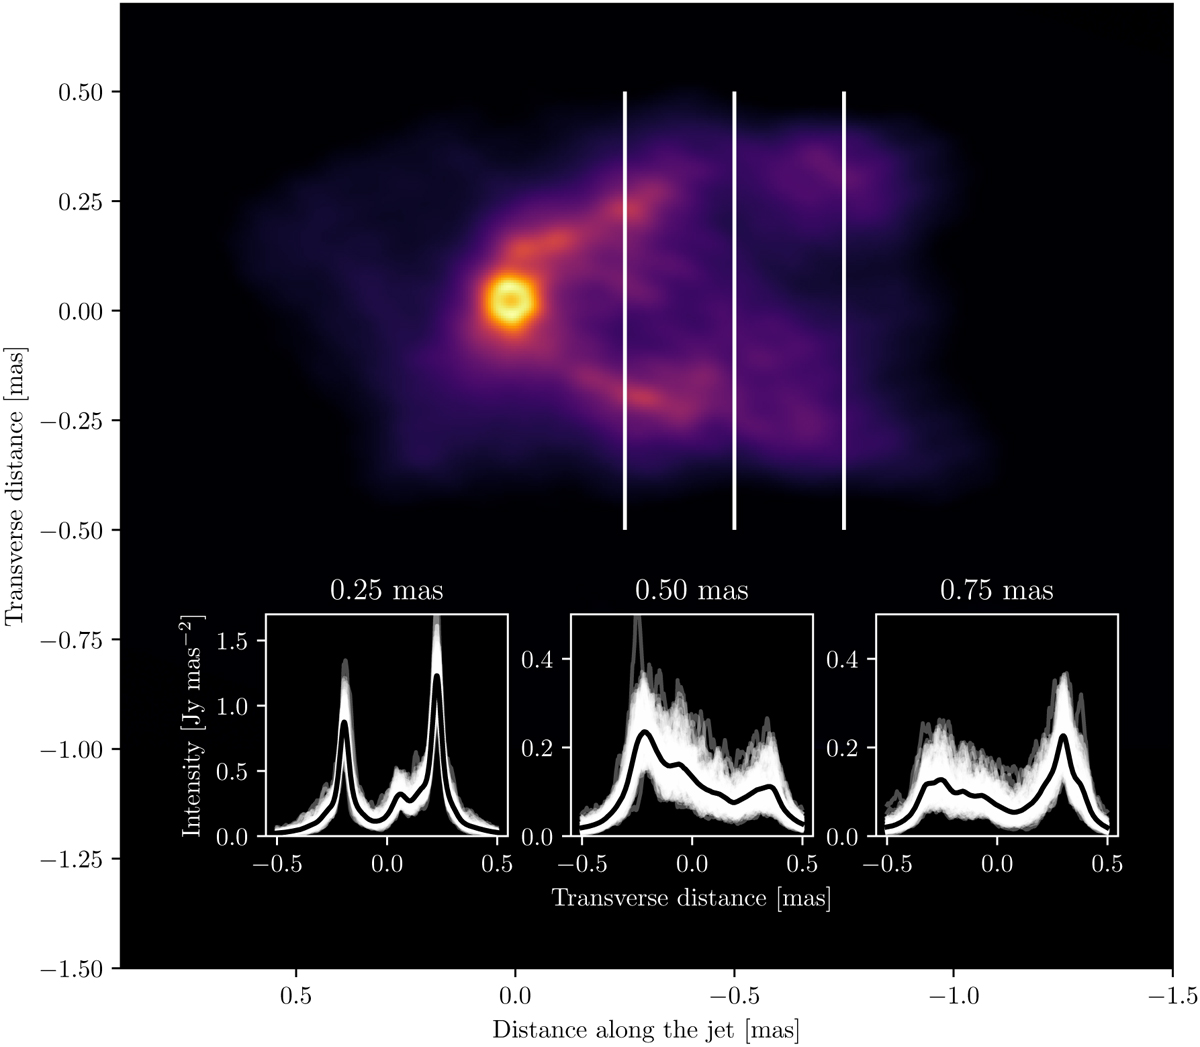
Fig. 4
Download original image
Galaxy M87 jet transverse profiles and intensity map obtained by resolve. Intensity in the map is represented by false color according to the color bar used in Fig. 1 in logarithmic scale. The image is rotated 18∘ clockwise. Intensity plots at the bottom of the figure show flux density profiles of the jet at 0.25, 0.5 and 0.75 mas from the phase center. Each vertical line corresponds to a location where profiles were extracted.
Current usage metrics show cumulative count of Article Views (full-text article views including HTML views, PDF and ePub downloads, according to the available data) and Abstracts Views on Vision4Press platform.
Data correspond to usage on the plateform after 2015. The current usage metrics is available 48-96 hours after online publication and is updated daily on week days.
Initial download of the metrics may take a while.