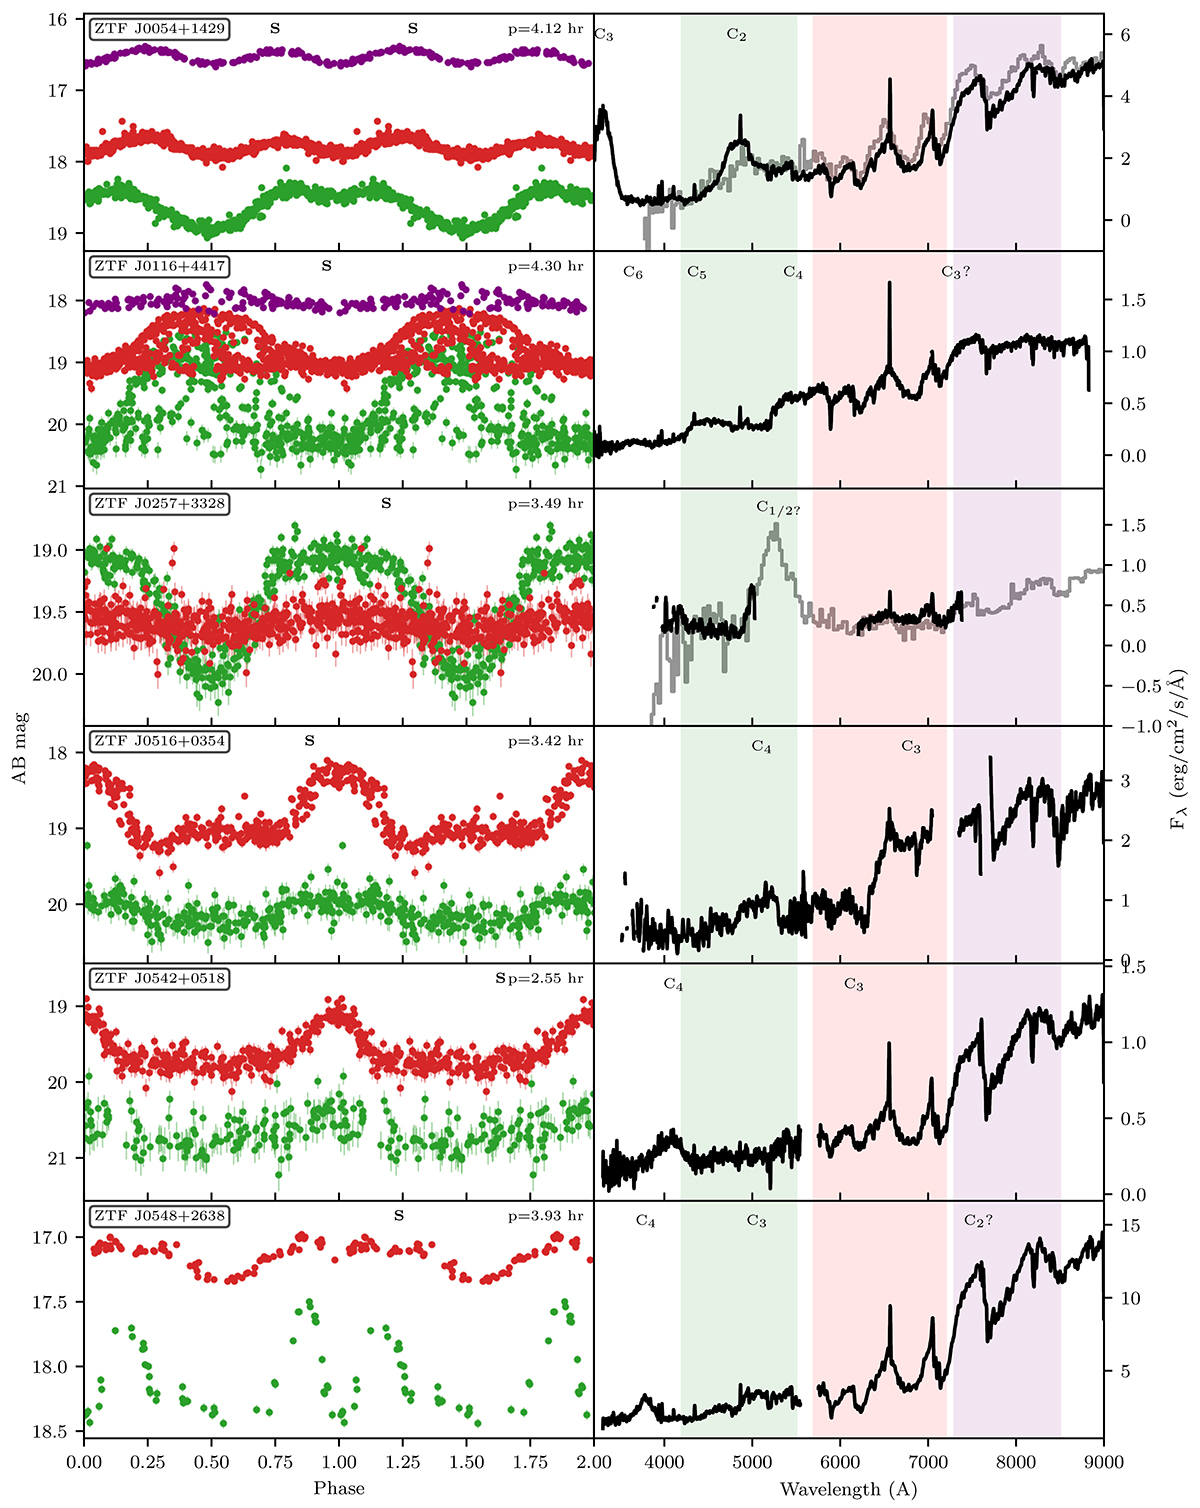
Fig. B.1.
Download original image
The left panels show the phase-folded ZTF g, r, and i light curves in green, red, and purple in AB magnitudes. The right panels show one or multiple spectra (normalised). SEDM spectra are shown in grey, and other spectra are shown in black. We indicate the cyclotron harmonics with ‘Cn’. The ‘S’ in the left panel indicates at what phase the spectra were obtained. The light curve of ZTF J0116+4417 is not strictly periodic, as shown in detail in Figure 3.
Current usage metrics show cumulative count of Article Views (full-text article views including HTML views, PDF and ePub downloads, according to the available data) and Abstracts Views on Vision4Press platform.
Data correspond to usage on the plateform after 2015. The current usage metrics is available 48-96 hours after online publication and is updated daily on week days.
Initial download of the metrics may take a while.