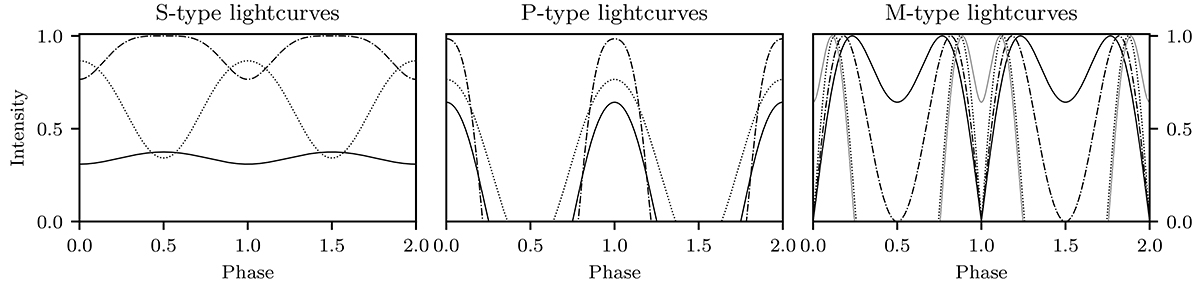
Fig. A.3.
Download original image
Model light curves for the different light curve shapes. The left panel shows approximately sinusoidal light curves from the ‘S’-labelled regions in Fig. A.2. They can have a range of amplitudes, average values, and shapes. The examples shown are for i = 10° and ϕ = 89°, 55°, 20° (full, dashdotted, dotted). The middle panel shows pulse-like light curves, labelled ‘P’ in Fig. A.2. They vary both in amplitude and width, but during atleast some of the phase the intensity is 0. The examples shown are for [i, ϕ] = [20°, 0°], [60°, −20°], [80°, 75°]; (full, dashdotted, dotted). The right panel shows ‘M’-shaped light curves, labelled ‘M’ in Fig. A.2. The examples shown are for with i = 35° ,45° ,80° and ϕ = 90° −i (full, dashed-dotted, dotted). The grey line shows a model i = 80° and ϕ = −10°.
Current usage metrics show cumulative count of Article Views (full-text article views including HTML views, PDF and ePub downloads, according to the available data) and Abstracts Views on Vision4Press platform.
Data correspond to usage on the plateform after 2015. The current usage metrics is available 48-96 hours after online publication and is updated daily on week days.
Initial download of the metrics may take a while.