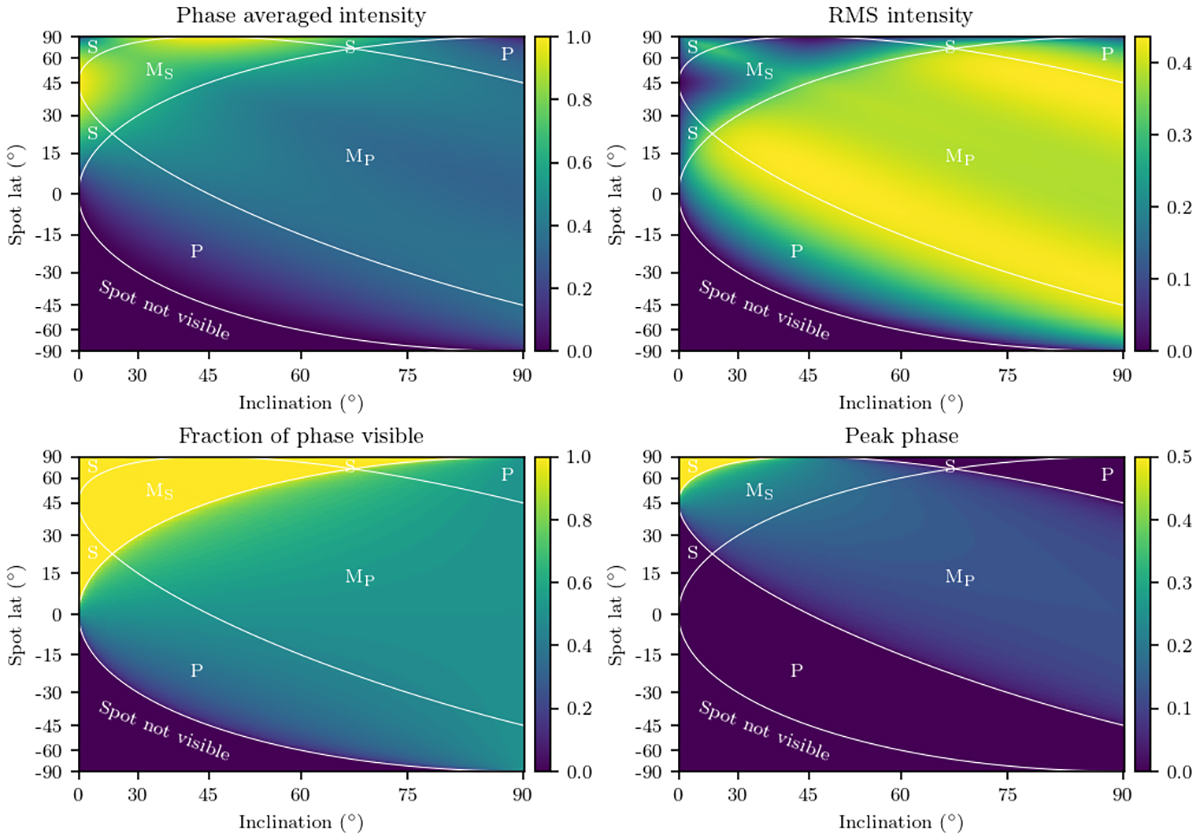
Fig. A.2.
Download original image
Overview of the light curve properties of the toy-model as function of the inclination angle (i) and spot latitude (ϕ). The figure shows that the light curve properties (average, amplitude, and shape) vary greatly depending on the geometry of the system. The white lines delineate the different light curve shapes. Examples of the different light curve shapes are shown in Fig. A.3
Current usage metrics show cumulative count of Article Views (full-text article views including HTML views, PDF and ePub downloads, according to the available data) and Abstracts Views on Vision4Press platform.
Data correspond to usage on the plateform after 2015. The current usage metrics is available 48-96 hours after online publication and is updated daily on week days.
Initial download of the metrics may take a while.