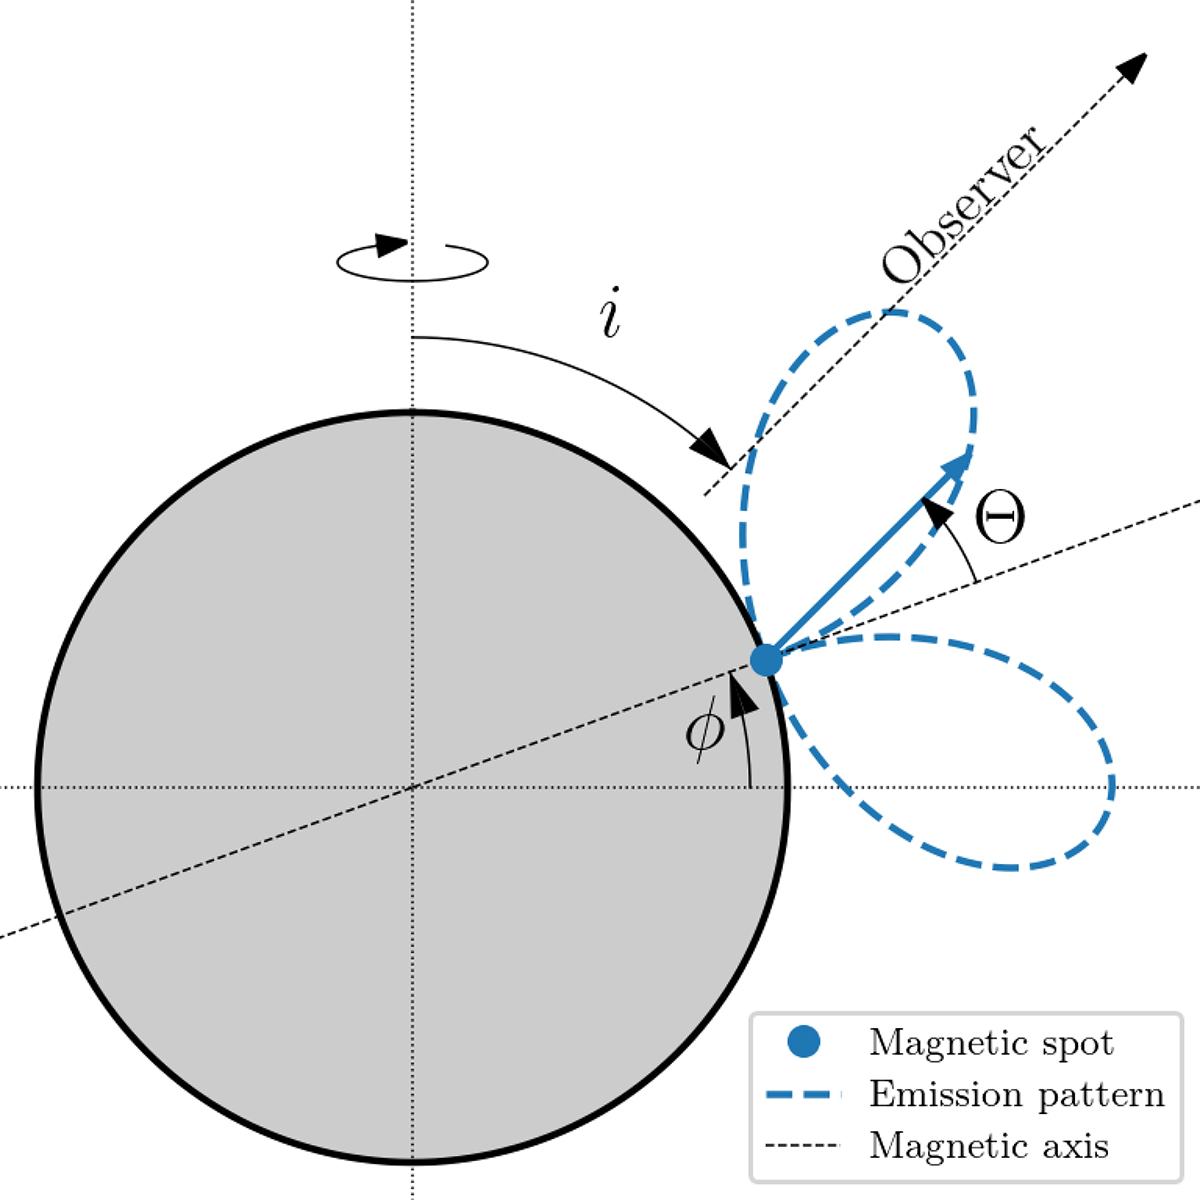
Fig. A.1.
Download original image
Toy-model of a rotating star with an emitting spot with a angular dependent emission pattern. The diagram shows a 2D crosssection for the phase when the spot is closest to the observer. The y-axis is the rotation axis of the sphere. The inclination of the system (i) is defined as the angle between the rotation axis and observer line-of-sight. The spot-latitude (ϕ) is defined as angular distance from the equator. The emission pattern indicates the emission intensity depending on the viewing angle (Θ, the 3D angle between the magnetic axis and observer line-of-sight).
Current usage metrics show cumulative count of Article Views (full-text article views including HTML views, PDF and ePub downloads, according to the available data) and Abstracts Views on Vision4Press platform.
Data correspond to usage on the plateform after 2015. The current usage metrics is available 48-96 hours after online publication and is updated daily on week days.
Initial download of the metrics may take a while.