Fig. 4.
Download original image
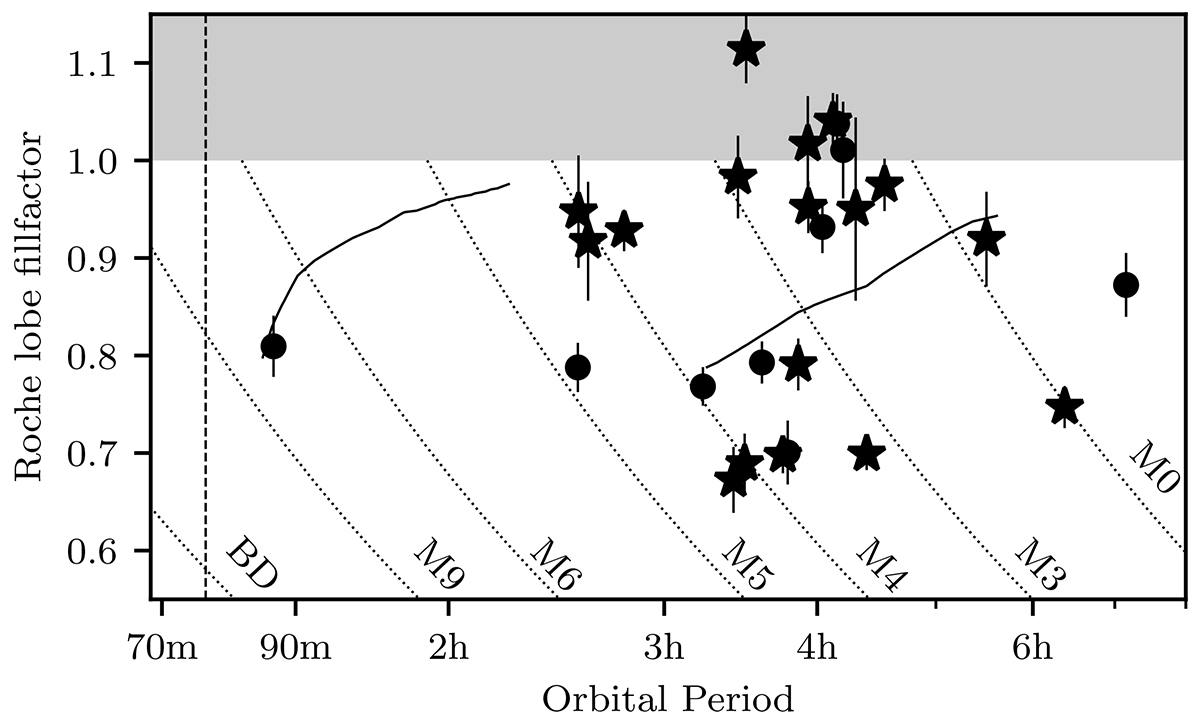
Best estimate of the Roche lobe fill factor (R2/RL, 2) for the donor star in each system, adapted from Parsons et al. (2021). Dots show previously known system, stars show the ZTF detected objects. Note that a few assumption have been made in order to calculate the Roche lobe fill factor, see Section 4.4. The dashed lines show the tracks for different companion stars if only the orbital period changes. Solid lines shows how much a cataclysmic variable would shrink if it were to detach (Knigge et al. 2011). The vertical dashed line shows the cataclysmic variable period minimum. The figure shows that some systems are clearly filling their Roche lobe and are likely low-state polars, while other systems are quite far from filling their Roche lobe and could be pre-polars. Note that systems that are filling their Roche-lobe (fill factor = 1) can result in the mass-estimate and therefore fillfactor estimate, to be overestimated.
Current usage metrics show cumulative count of Article Views (full-text article views including HTML views, PDF and ePub downloads, according to the available data) and Abstracts Views on Vision4Press platform.
Data correspond to usage on the plateform after 2015. The current usage metrics is available 48-96 hours after online publication and is updated daily on week days.
Initial download of the metrics may take a while.