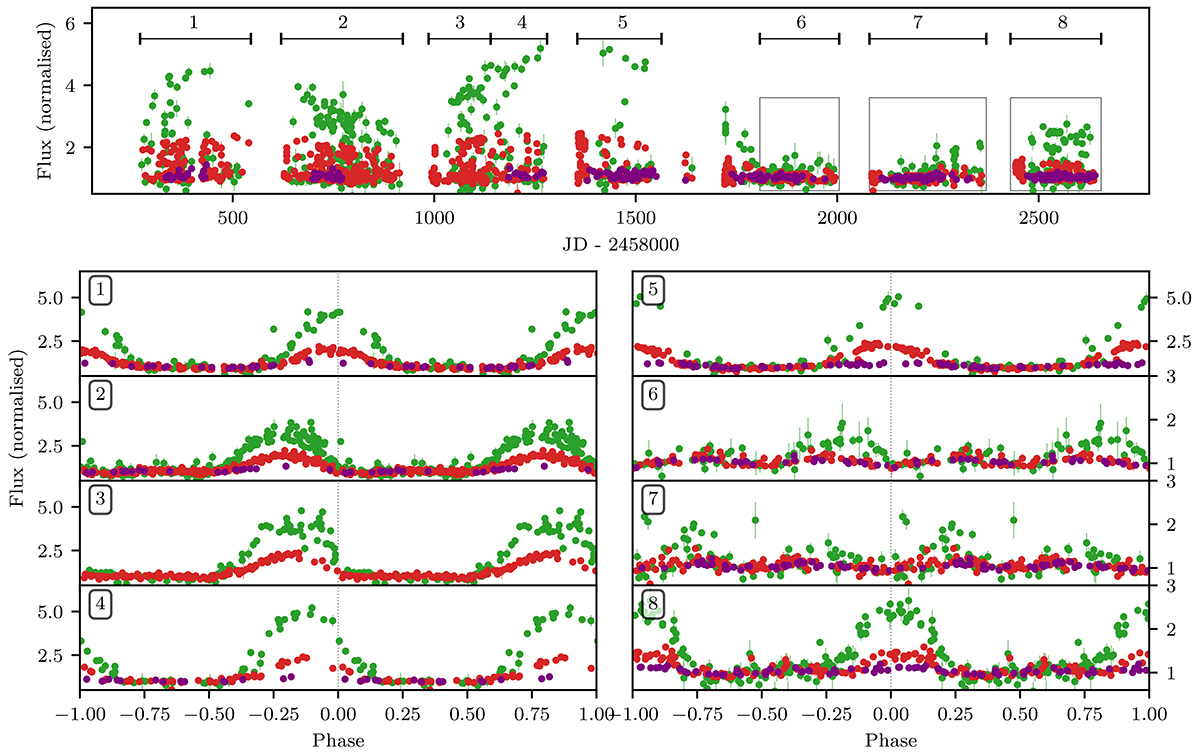
Fig. 3.
Download original image
ZTF light curve of ZTF J0116+4417. The top panel shows the full light curve and clearly shows that the amplitude of variability changes over a timescale of years. In the bottom panels, we show the folded light curves per part of the data as indicated in the top panel. The y-scale is the same for each panel, except for the bottom-right panel, which shows a more zoomed-in view. The bottom panels show that both the amplitude and the peak-phase change slowly over time. For example, the difference in peak-phase between year 1 and year 2 is almost 0.2 in phase, and the amplitude change between panel 3 and 4 is almost a factor of 2.
Current usage metrics show cumulative count of Article Views (full-text article views including HTML views, PDF and ePub downloads, according to the available data) and Abstracts Views on Vision4Press platform.
Data correspond to usage on the plateform after 2015. The current usage metrics is available 48-96 hours after online publication and is updated daily on week days.
Initial download of the metrics may take a while.