Fig. 1.
Download original image
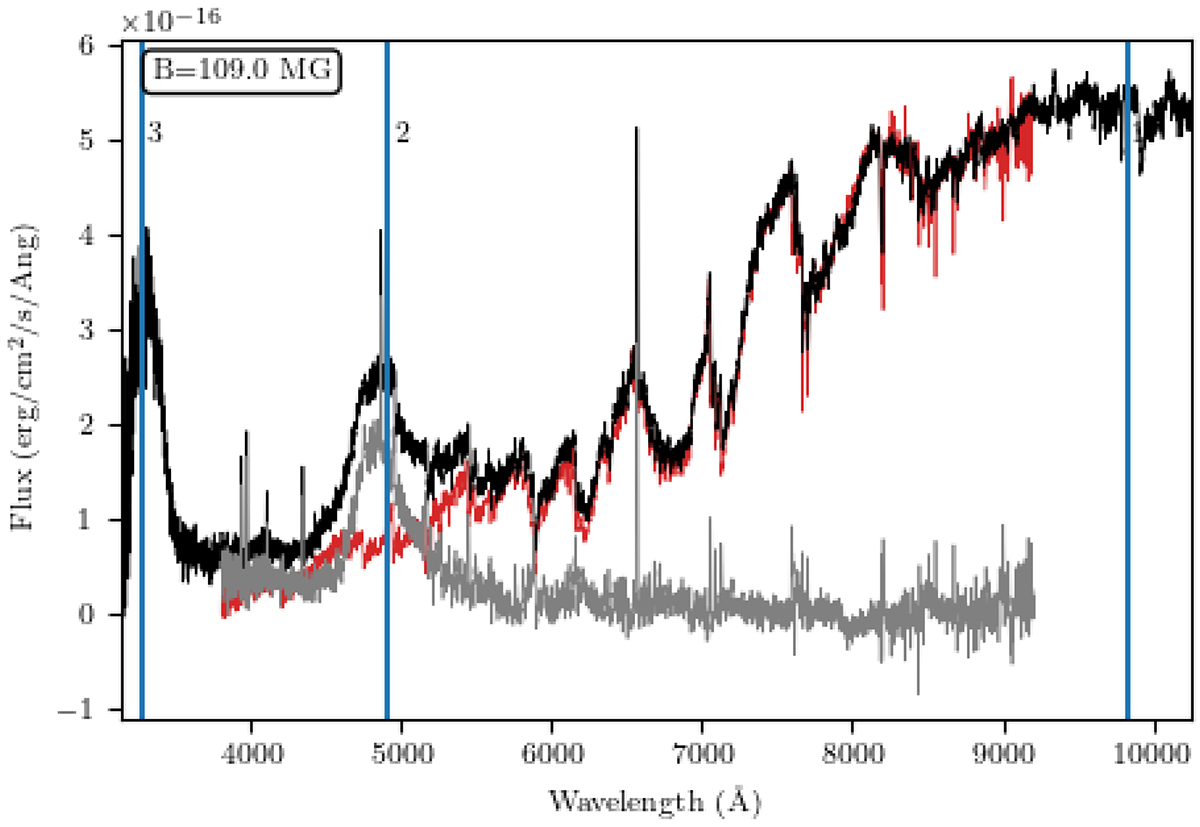
Example (ZTF J0054+1429) of how we determined the magnetic field strength from the spectra. The black line shows the spectrum, the red line the best-fit red dwarf template, and in grey the difference. The blue vertical lines show the cyclotron harmonic wavelengths for the selected magnetic field strength (the numbers next to the lines indicate which harmonic). We used an interactive version of this figure where the B-field strength can be set with a slider to quickly check at which wavelengths the different harmonics should be located.
Current usage metrics show cumulative count of Article Views (full-text article views including HTML views, PDF and ePub downloads, according to the available data) and Abstracts Views on Vision4Press platform.
Data correspond to usage on the plateform after 2015. The current usage metrics is available 48-96 hours after online publication and is updated daily on week days.
Initial download of the metrics may take a while.