Open Access
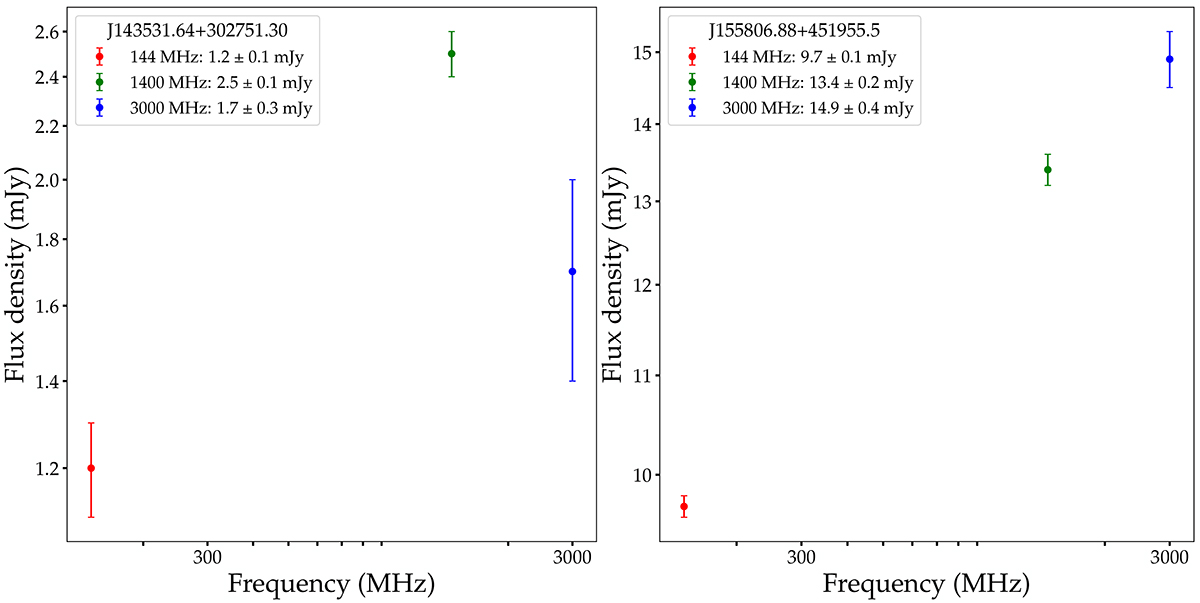
Fig. 7.
Download original image
Radio spectra of two candidate Gigahertz-peaked spectrum (GPS) sources from the G-DDRG sample. Flux densities measured from LoTSS, FIRST, and VLASS are represented in red, green, and blue, respectively (see Sect. 4.6).
Current usage metrics show cumulative count of Article Views (full-text article views including HTML views, PDF and ePub downloads, according to the available data) and Abstracts Views on Vision4Press platform.
Data correspond to usage on the plateform after 2015. The current usage metrics is available 48-96 hours after online publication and is updated daily on week days.
Initial download of the metrics may take a while.