Fig. B.1.
Download original image
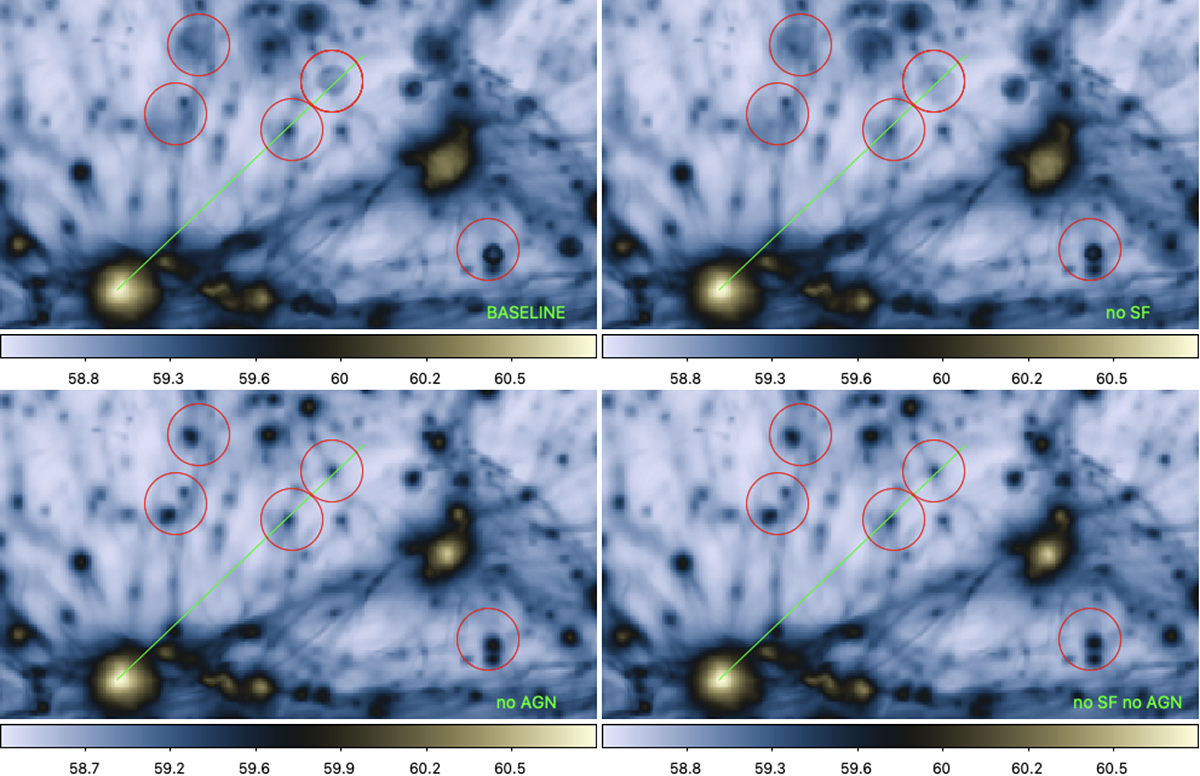
Maps of the total number of CRe (injected by shocks only, in units of [log10(NCRe)]) along the LoS of a 10 × 10Mpc2 zoomed region in our test runs, where we included all sources of feedback in the simulation (’baseline’ model, as in the main paper) or we switched off AGN feedback (’no AGN’) or stellar feedback (’no SF’), or both (’no SF no AGN’). The red circles identify regions in which obvious differences are visible between models, while the green lines show the direction for which we generated radial profiles of the number of CRe in Fig. A.4.
Current usage metrics show cumulative count of Article Views (full-text article views including HTML views, PDF and ePub downloads, according to the available data) and Abstracts Views on Vision4Press platform.
Data correspond to usage on the plateform after 2015. The current usage metrics is available 48-96 hours after online publication and is updated daily on week days.
Initial download of the metrics may take a while.