Fig. 22.
Download original image
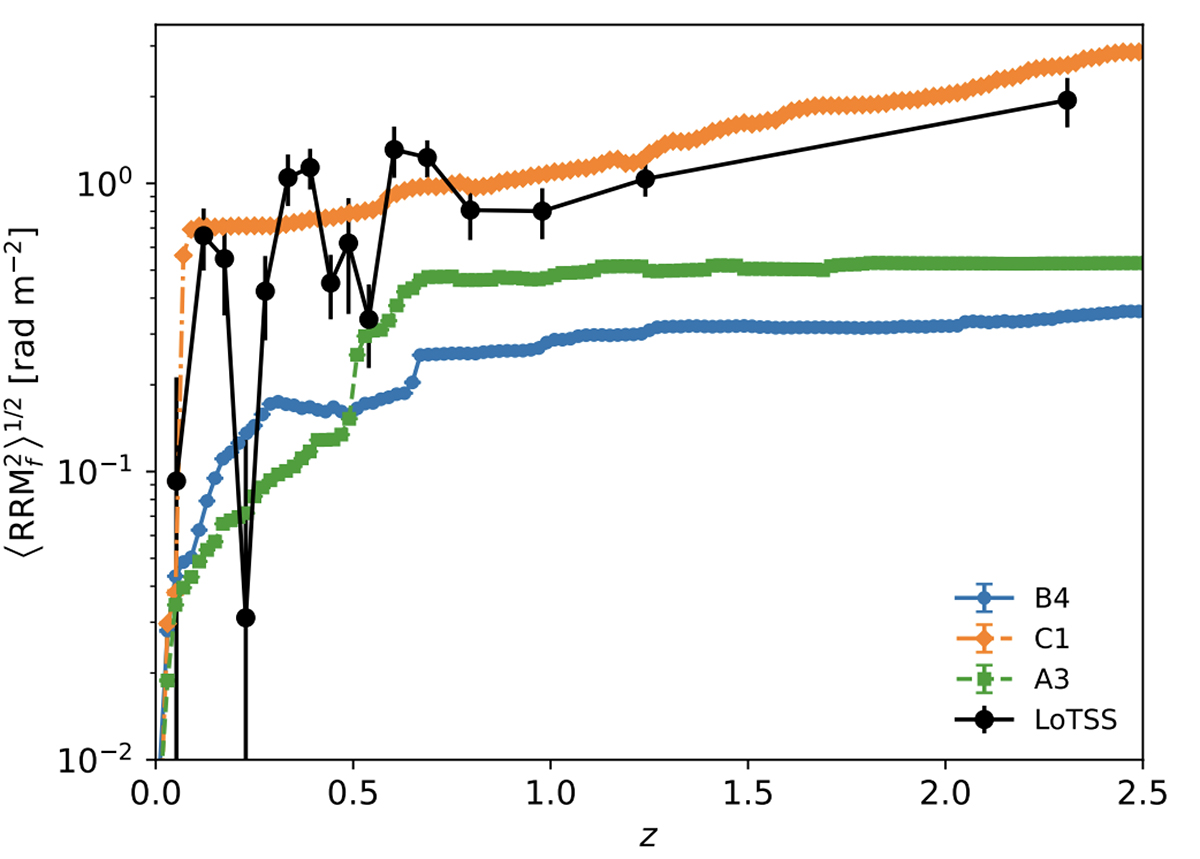
Trend of simulated rms of the residual Faraday RM, observed at z = 0 and for integrating out to increasingly larger redshift (up to z = 2.5), for our A3, B4, and C1 runs. The lines give the mean dispersion of the RRMf for 100 randomly selected lines of sight through the simulated volume, while the black line with larger error bars shows the observed RRM trend by LOFAR, taken from Carretti et al. (2024).
Current usage metrics show cumulative count of Article Views (full-text article views including HTML views, PDF and ePub downloads, according to the available data) and Abstracts Views on Vision4Press platform.
Data correspond to usage on the plateform after 2015. The current usage metrics is available 48-96 hours after online publication and is updated daily on week days.
Initial download of the metrics may take a while.