Open Access
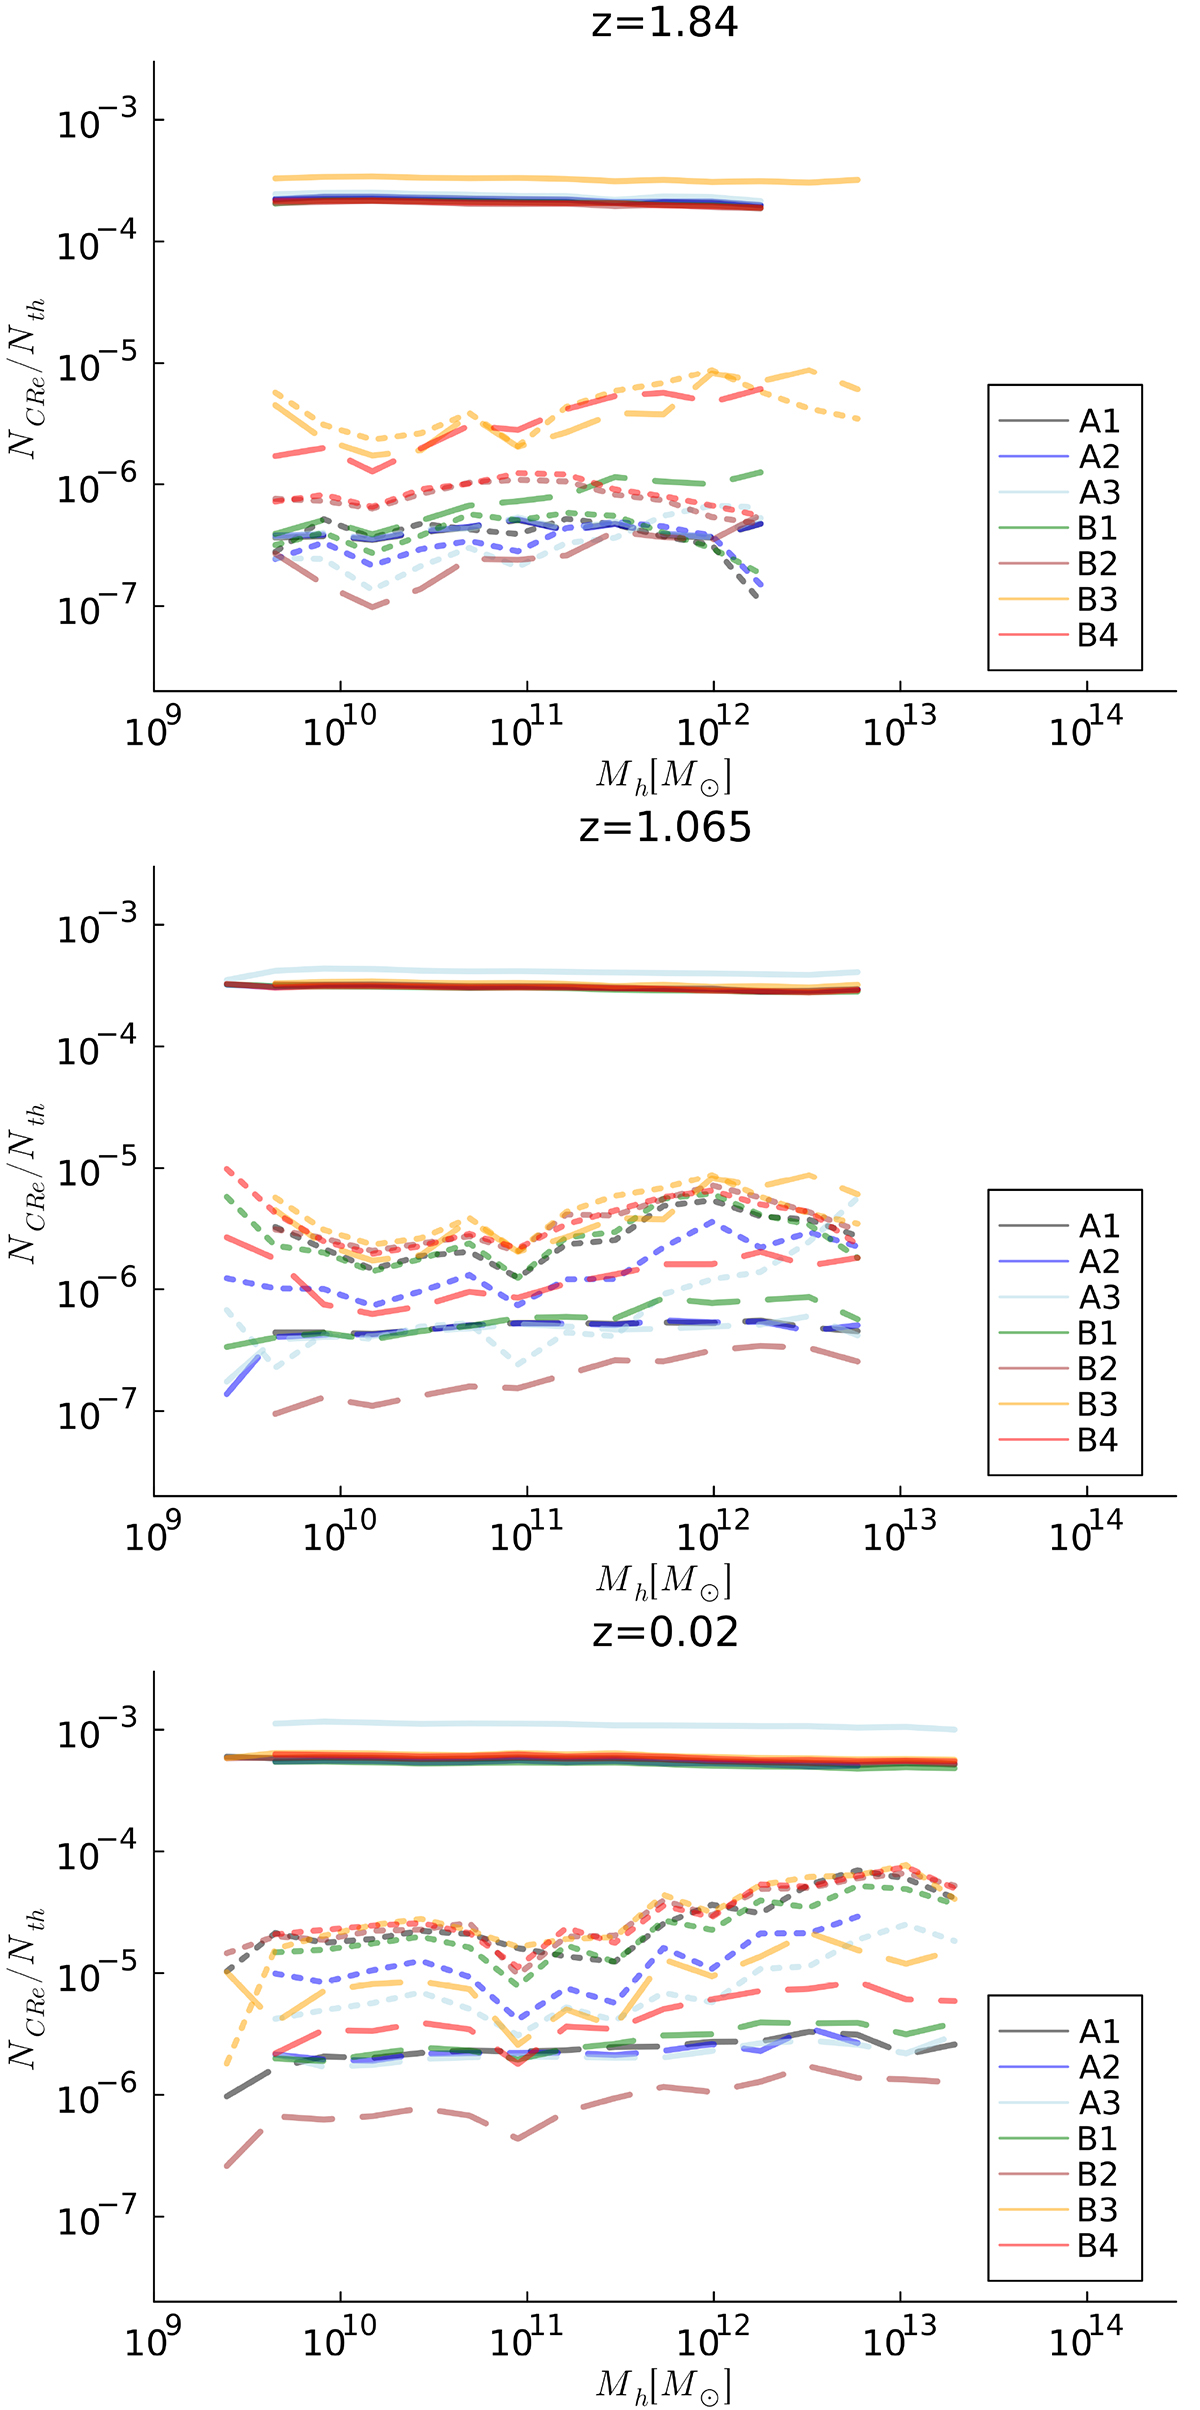
Fig. 20.
Download original image
Distribution of the ratio between CRe density and baryon density within R500 of our halos at three different epochs and for all runs. The solid lines show the distribution of CRe injected by shocks, the dotted lines by AGNs and the dashed lines by star formation.
Current usage metrics show cumulative count of Article Views (full-text article views including HTML views, PDF and ePub downloads, according to the available data) and Abstracts Views on Vision4Press platform.
Data correspond to usage on the plateform after 2015. The current usage metrics is available 48-96 hours after online publication and is updated daily on week days.
Initial download of the metrics may take a while.