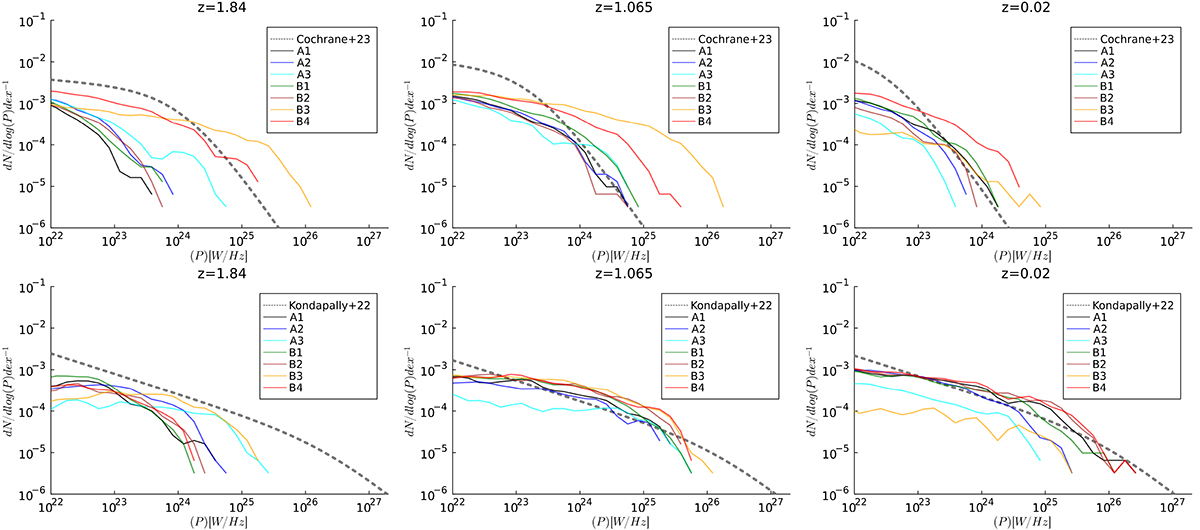
Fig. 16.
Download original image
Top row: Evolving distribution function of radio power at 150 MHz from our simulated galaxies, in which only the radio emission from CRe injected by star formation is considered. Bottom row: Evolving distribution function of radio power at 150 MHz from our simulated galaxies, in which only the radio emission from CRe injected by AGNs is considered. The dotted grey lines in the top rows give the best-fit relation of observed data with LOFAR, in the same redshift bins, from Cochrane et al. (2023) (top) and Kondapally et al. (2022) (bottom).
Current usage metrics show cumulative count of Article Views (full-text article views including HTML views, PDF and ePub downloads, according to the available data) and Abstracts Views on Vision4Press platform.
Data correspond to usage on the plateform after 2015. The current usage metrics is available 48-96 hours after online publication and is updated daily on week days.
Initial download of the metrics may take a while.