Fig. 8.
Download original image
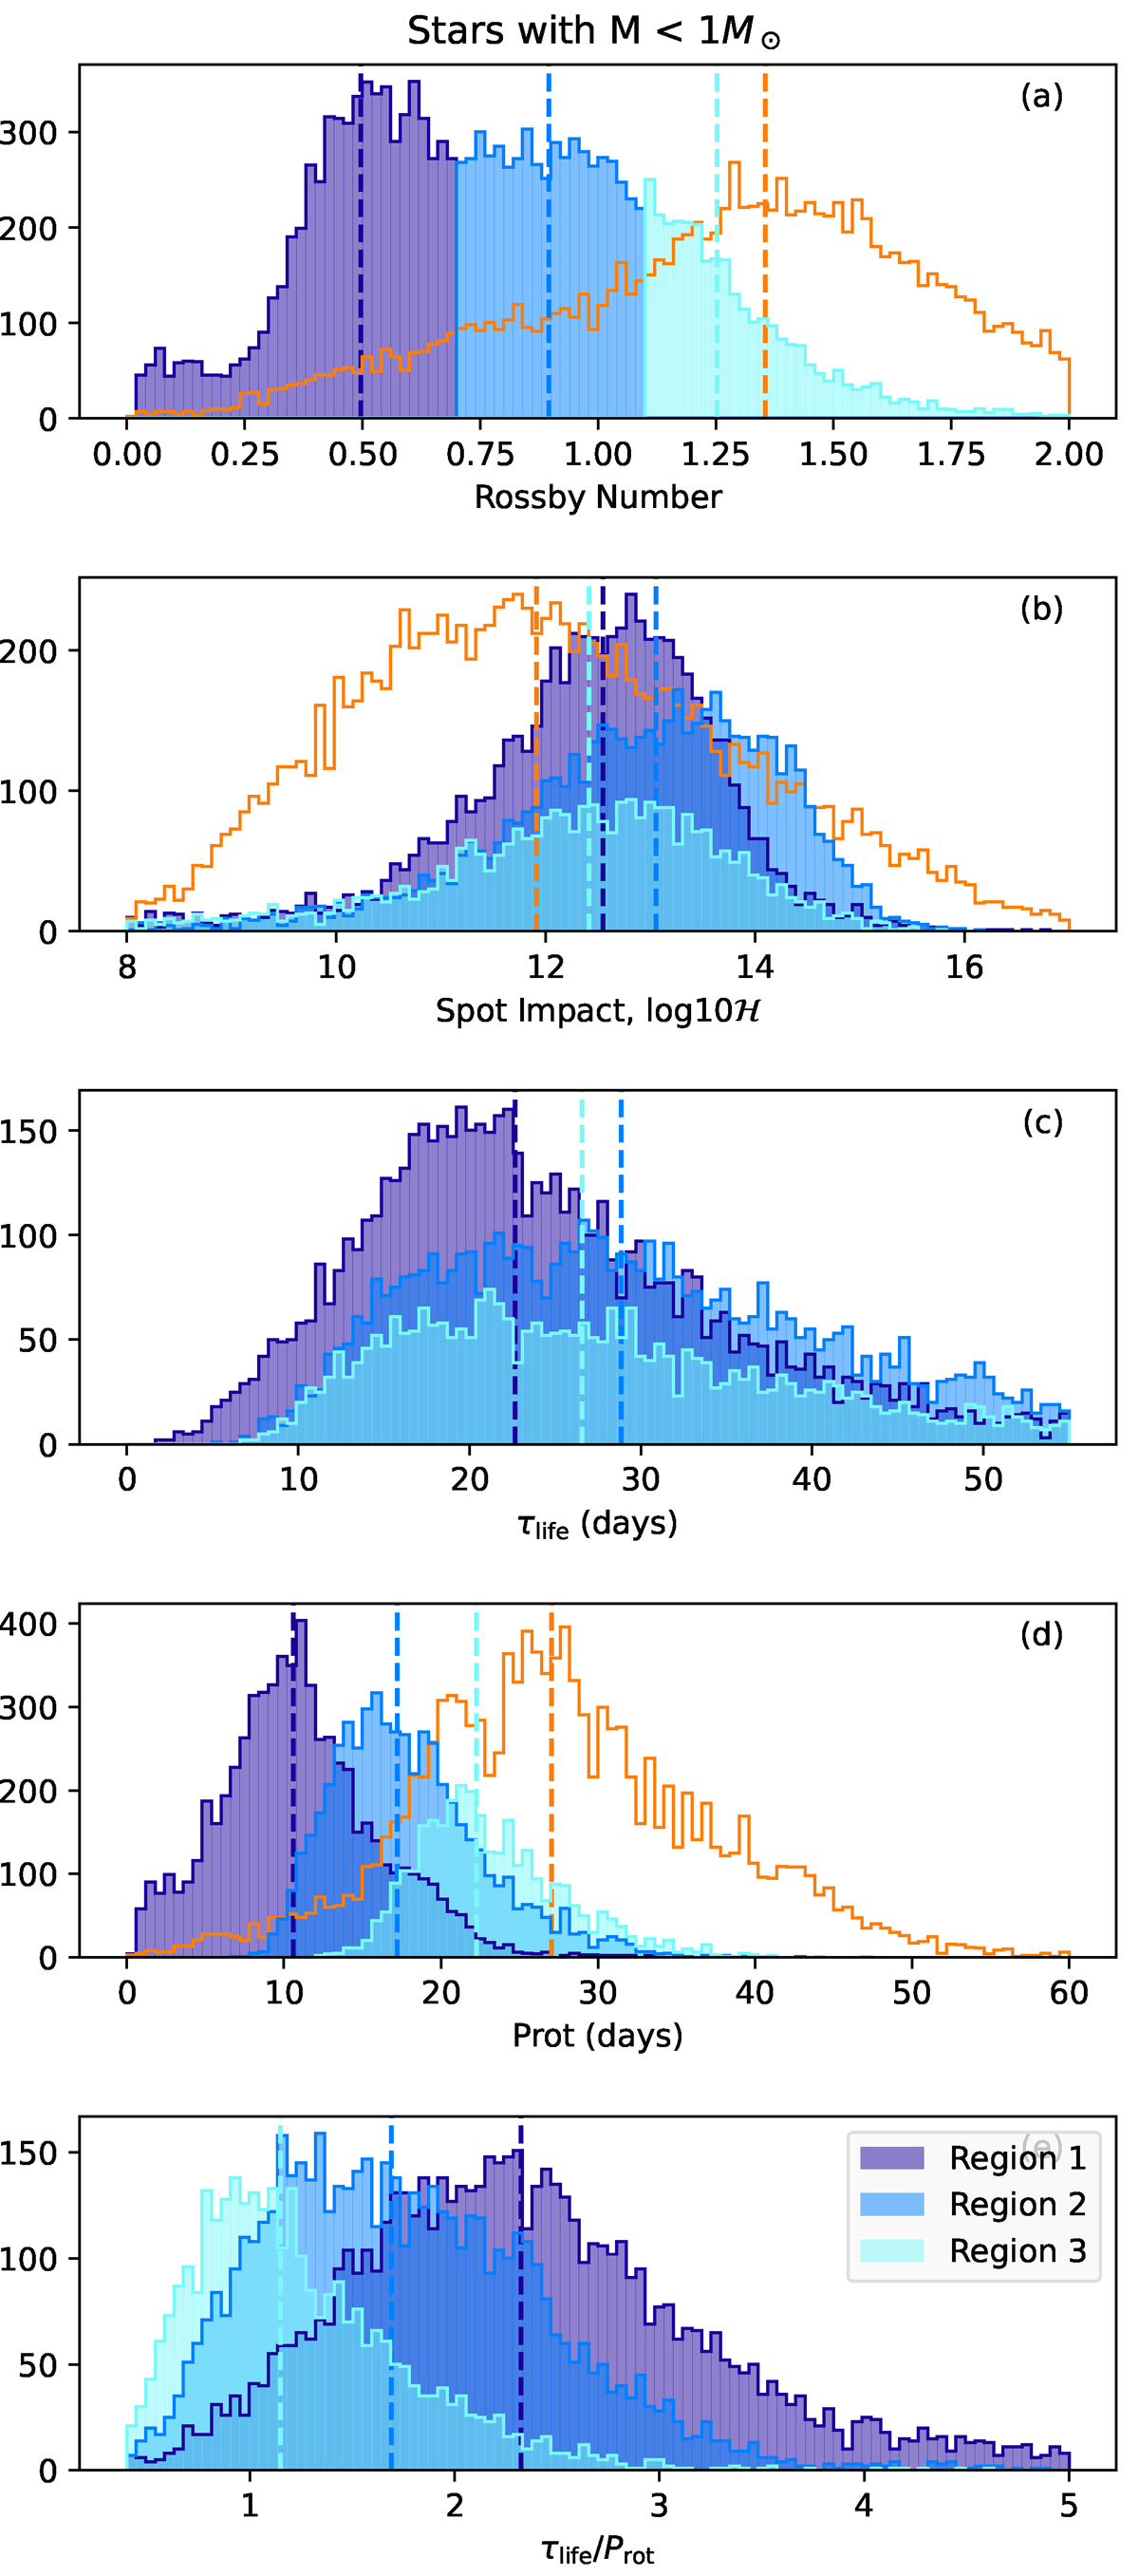
Histograms for the three different regions and the peakless sample as a function of different stellar parameters. In blue: Sample of stars with rotation peaks. The different shades of blue correspond to the three regions of Fig. 6 cut according to the Rossby number. This slicing is illustrated in panel (a) as a function of the Rossby number. The orange histograms represent the peakless group. From top to bottom, the histograms are for (a) the Rossby Number, (b) spot impact proxy, (c) the mean lifetime τlife,(d) the rotation period, and finally (e) the ratio Prot/τlife.
Current usage metrics show cumulative count of Article Views (full-text article views including HTML views, PDF and ePub downloads, according to the available data) and Abstracts Views on Vision4Press platform.
Data correspond to usage on the plateform after 2015. The current usage metrics is available 48-96 hours after online publication and is updated daily on week days.
Initial download of the metrics may take a while.