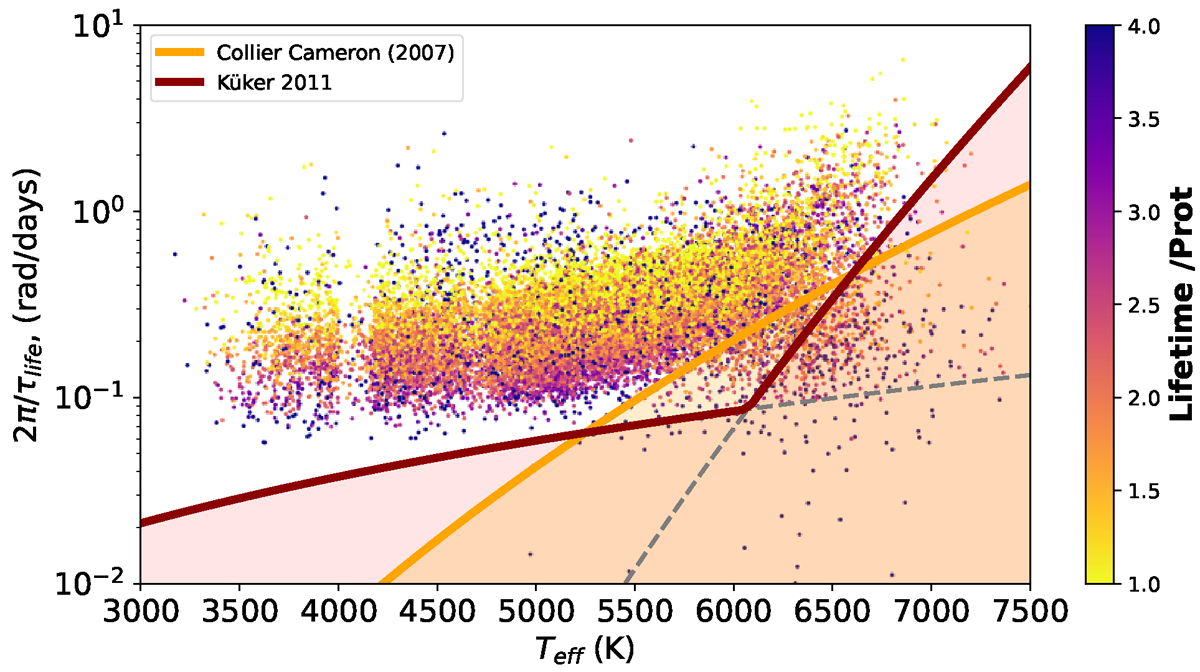
Fig. 11.
Download original image
Spot lifetime estimation expressed in radians per days as a function of the effective temperature in K. The orange line is the Teff − ΔΩ relation proposed by Collier Cameron (2007), with ΔΩ in days. The dark red line is the relation from Küker & Rüdiger (2011), with the dashed lines representing the two components of this relation. The hatched regions are the ones where Eq. (20) is not verify, for instance the DR may affect the lifetime estimation, τlife.
Current usage metrics show cumulative count of Article Views (full-text article views including HTML views, PDF and ePub downloads, according to the available data) and Abstracts Views on Vision4Press platform.
Data correspond to usage on the plateform after 2015. The current usage metrics is available 48-96 hours after online publication and is updated daily on week days.
Initial download of the metrics may take a while.