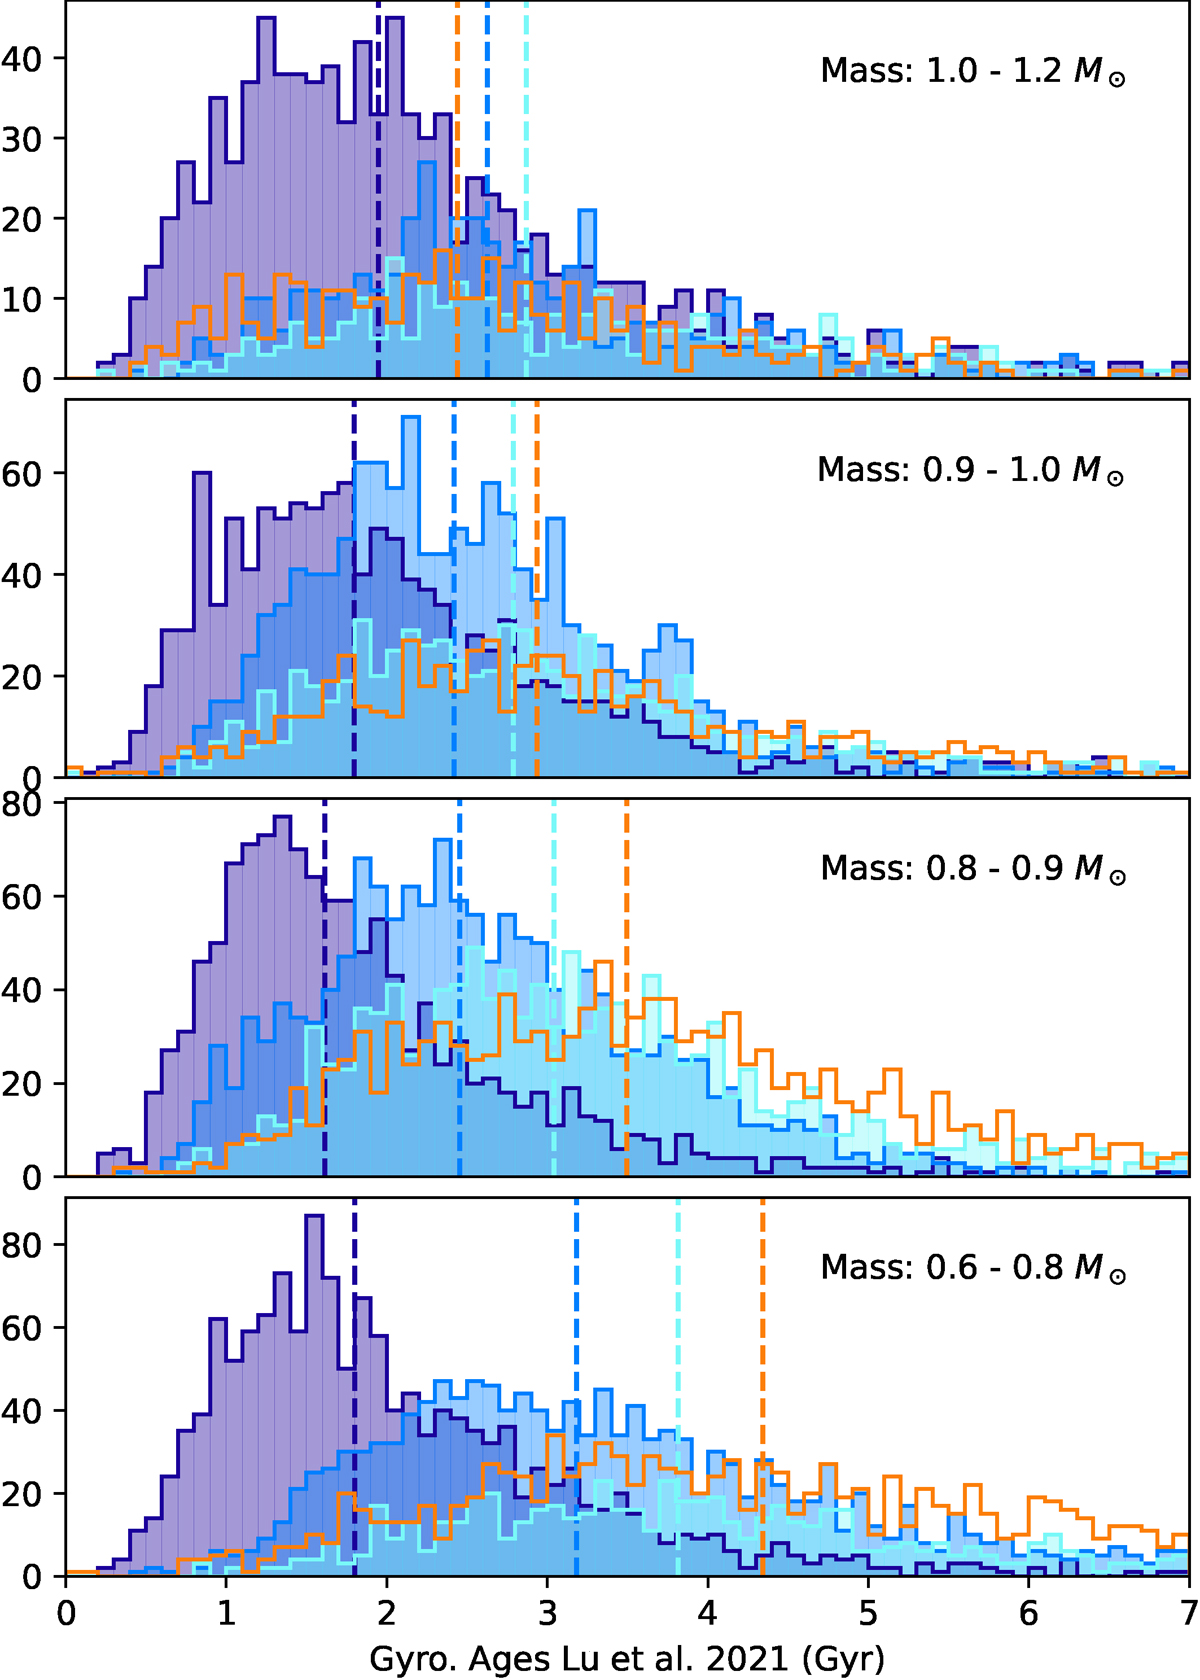
Fig. 10.
Download original image
Distribution of star ages for increasing mass intervals. Each row corresponds to a decreasing mass interval (from 1 to 1.2 M⊙ for the first row, 0.9 to 1.0 M⊙ for the second row, 0.8 to 0.9 M⊙ for the third row and 0.6 to 0.8 M⊙ for the last row). The colours of the histograms correspond to the different regions of Figure 6. For each of these histograms, a line of the same colour is drawn to represent the median of the histogram.
Current usage metrics show cumulative count of Article Views (full-text article views including HTML views, PDF and ePub downloads, according to the available data) and Abstracts Views on Vision4Press platform.
Data correspond to usage on the plateform after 2015. The current usage metrics is available 48-96 hours after online publication and is updated daily on week days.
Initial download of the metrics may take a while.