Fig. 1.
Download original image
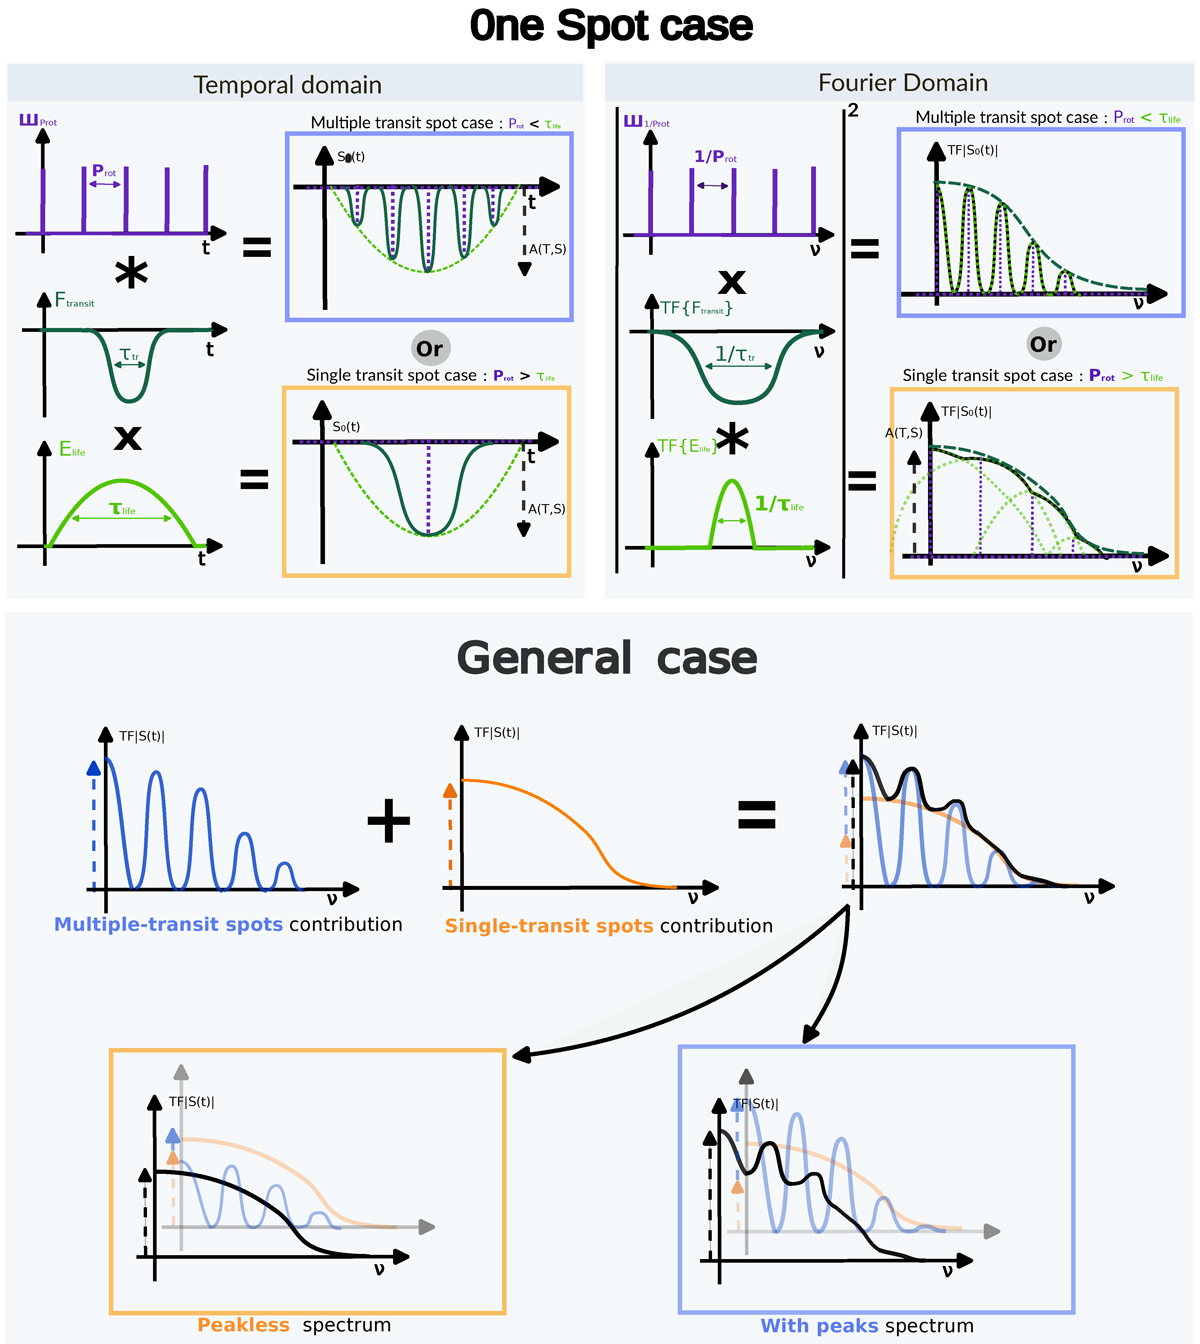
Illustration of the analytical description of the spot transit proposed in this paper. The top panel shows the model for the single-spot case. The model is shown in the time domain on the left, and in the Fourier domain on the right. Each time, the distinction is made between the single-transit-spot/peakless case (orange) and the multiple-transit-spot/with peaks case (blue). The bottom of the figure illustrates the general case with both multiple-transit and single-transit spots’ contributions.
Current usage metrics show cumulative count of Article Views (full-text article views including HTML views, PDF and ePub downloads, according to the available data) and Abstracts Views on Vision4Press platform.
Data correspond to usage on the plateform after 2015. The current usage metrics is available 48-96 hours after online publication and is updated daily on week days.
Initial download of the metrics may take a while.