Fig. 9
Download original image
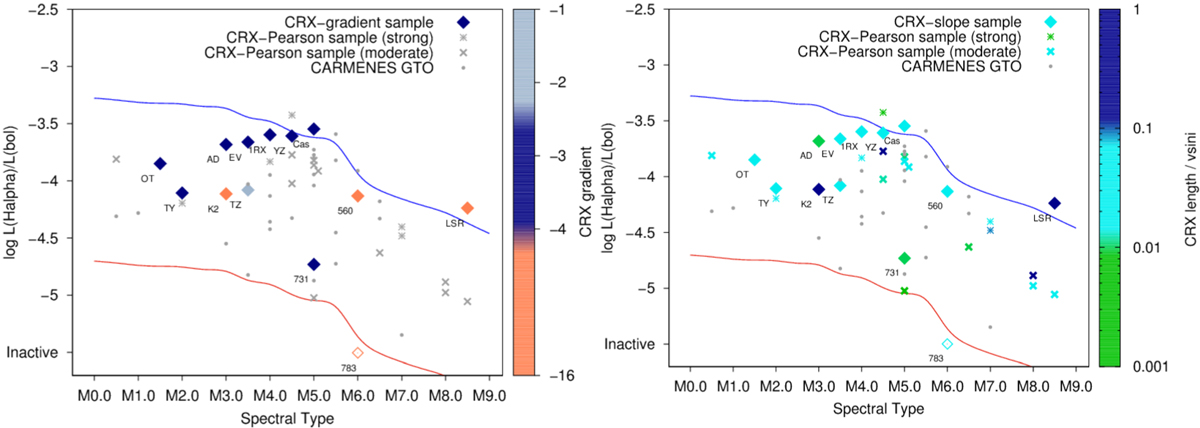
Normalised Hα luminosities as a function of spectral type for CARMENES GTO sample with Nobs > 25. The solid orange line indicates the minimum values of emission in the Hα line that our CARMENES observations can detect, which is defined to be pEW (Hα) = −0.3 Å (Schöfer et al. 2019). A population of extremely active stars with pEW(Hα < −8.0 are indicated by the solid blue line as previously noted by Jeffers et al. (2018). Hα inactive stars are shown at the base of each plot as indicated by the y-axis. The stars in the CRX-slope sample are indicated by the diamond shapes which are coloured based on the CRX gradient of the data points in the left panel and CRX-length in the right panel. The stars are labelled as indicated in Table A.1.
Current usage metrics show cumulative count of Article Views (full-text article views including HTML views, PDF and ePub downloads, according to the available data) and Abstracts Views on Vision4Press platform.
Data correspond to usage on the plateform after 2015. The current usage metrics is available 48-96 hours after online publication and is updated daily on week days.
Initial download of the metrics may take a while.