Fig. 7
Download original image
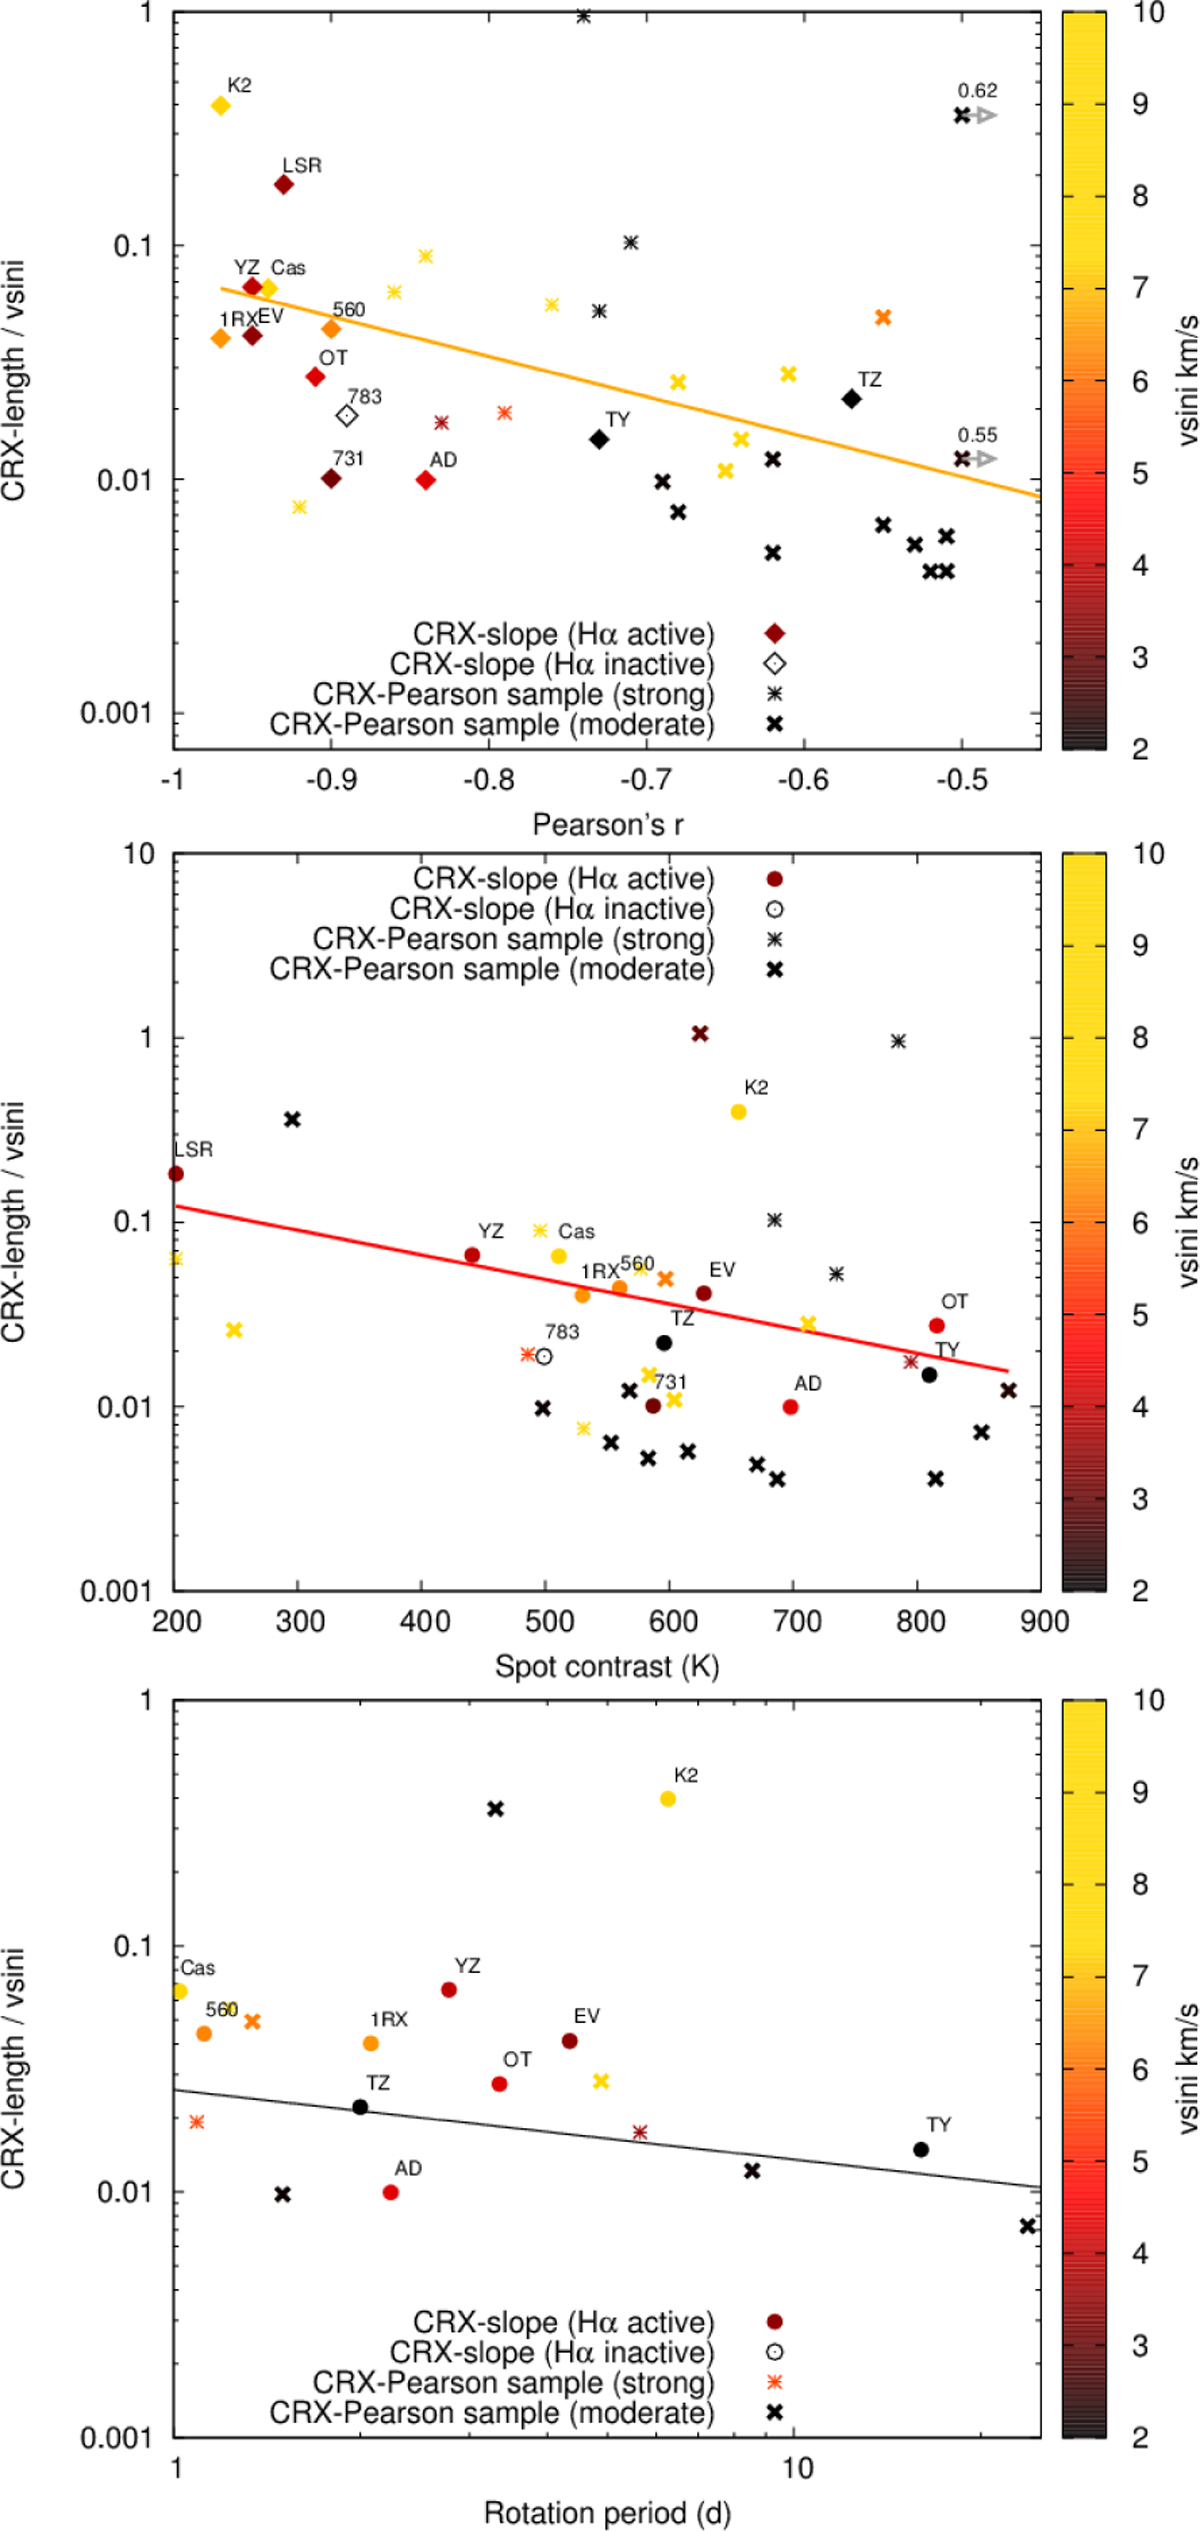
Dependence of the CRX-length as a function of Pearson’s r value (upper panel), spot contrast (middle panel), and rotation period (lower panel) for the CRX-all stars sample. Closed symbols indicate Hα active stars and open symbols Hα inactive stars. Points are coloured by projected stellar rotational velocity (v sin i). The CRX-slope stars are labelled as indicated in Table A.1. In the top panel, the two arrows indicate two stars with positive Pearson’s r correlation. Their true Pearson’s value is shown in the label for each point. The parameters of the fitted straight lines are summarised in Table 5.
Current usage metrics show cumulative count of Article Views (full-text article views including HTML views, PDF and ePub downloads, according to the available data) and Abstracts Views on Vision4Press platform.
Data correspond to usage on the plateform after 2015. The current usage metrics is available 48-96 hours after online publication and is updated daily on week days.
Initial download of the metrics may take a while.