Open Access
Fig. 15
Download original image
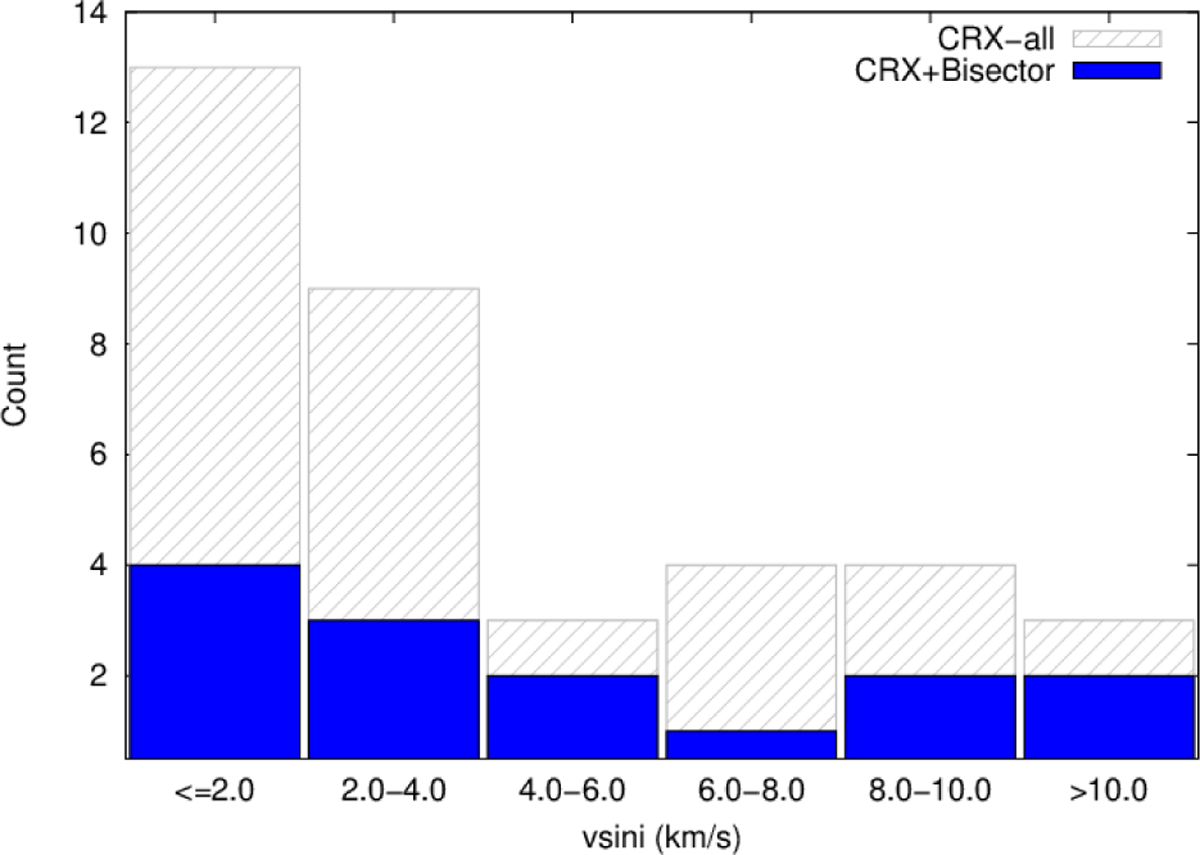
v sin i distribution of all 39 stars in the CRX-all sample (CRX-slope and CRX-Pearson) shown as grey shaded bars. The stars with a strong or a moderate correlation of the CRX with BIS are shown in blue.
Current usage metrics show cumulative count of Article Views (full-text article views including HTML views, PDF and ePub downloads, according to the available data) and Abstracts Views on Vision4Press platform.
Data correspond to usage on the plateform after 2015. The current usage metrics is available 48-96 hours after online publication and is updated daily on week days.
Initial download of the metrics may take a while.