Fig. 14
Download original image
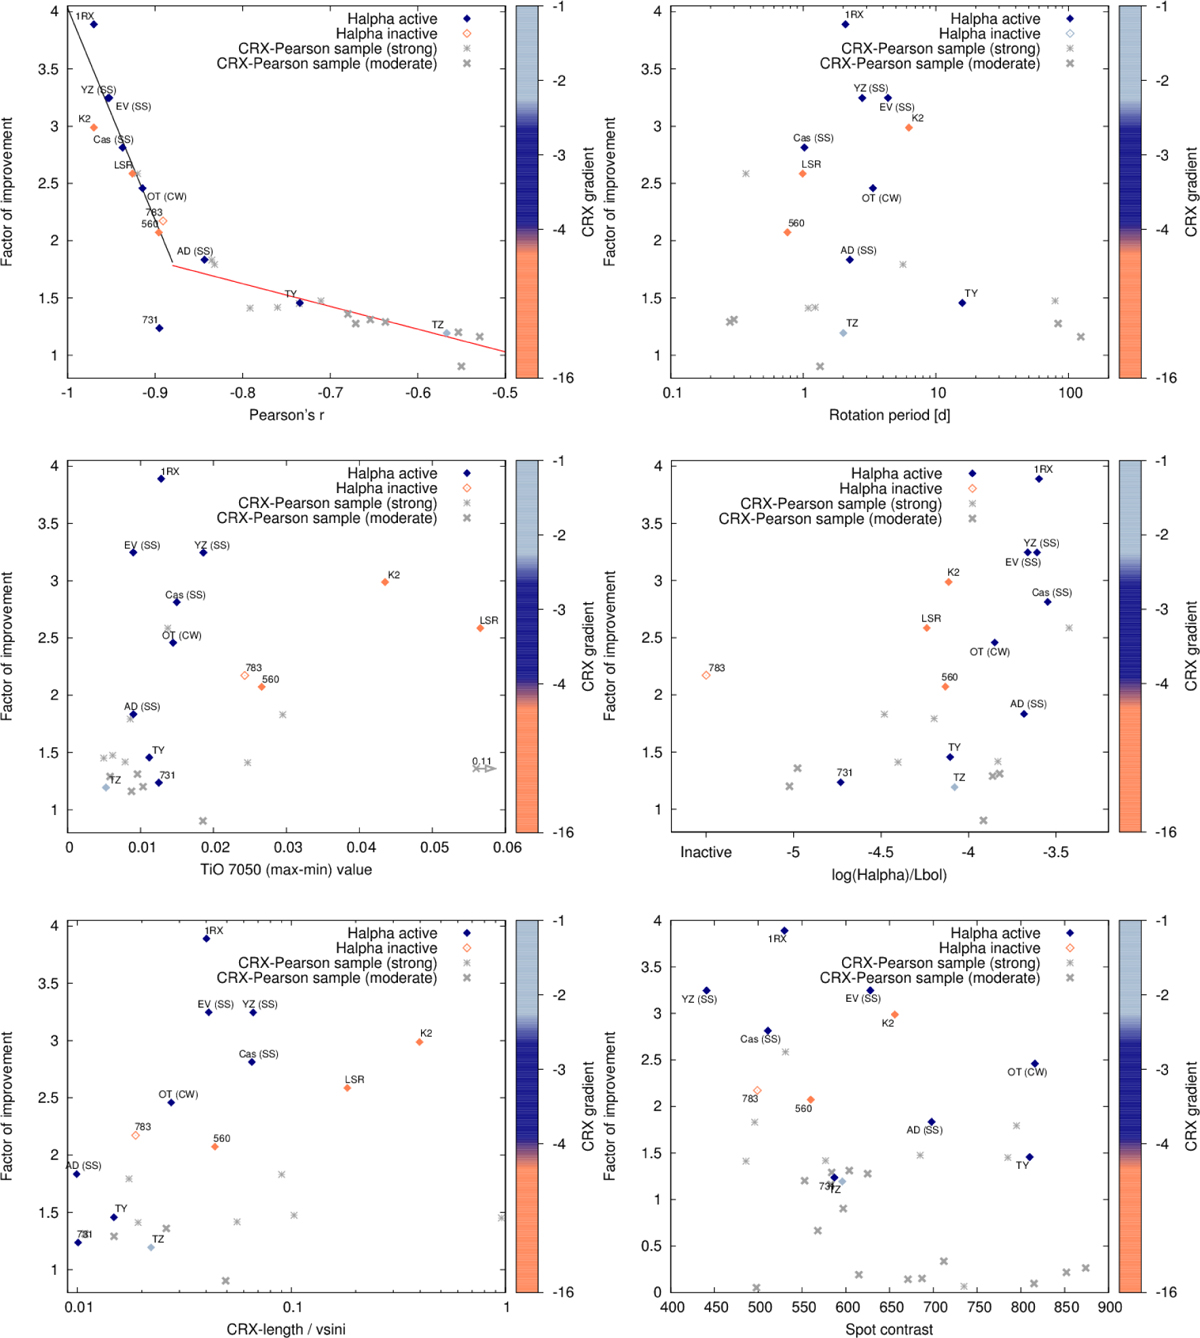
Factor of improvement in the RV rms from the subtraction of the RV estimated from the RV-CRX correlation for each star in the CRX-all sample. Filled points indicate Hα active stars while open points show Hα inactive stars. Symbols are coloured based on CRX-gradient value or none (grey points). The factor of improvement is shown as a function of Pearson’s r (see Table 5 for parameters of the fit), stellar rotation period (upper row, left and right), stellar TiO7050 max-min value (using 95% percentiles) and normalised Hα luminosity (middle row left and right) and CRX-length/v sin i and (zoomed) spot contrast ratio (lower row, left and right). The stars are labelled as in Table A.1.
Current usage metrics show cumulative count of Article Views (full-text article views including HTML views, PDF and ePub downloads, according to the available data) and Abstracts Views on Vision4Press platform.
Data correspond to usage on the plateform after 2015. The current usage metrics is available 48-96 hours after online publication and is updated daily on week days.
Initial download of the metrics may take a while.