Fig. 1
Download original image
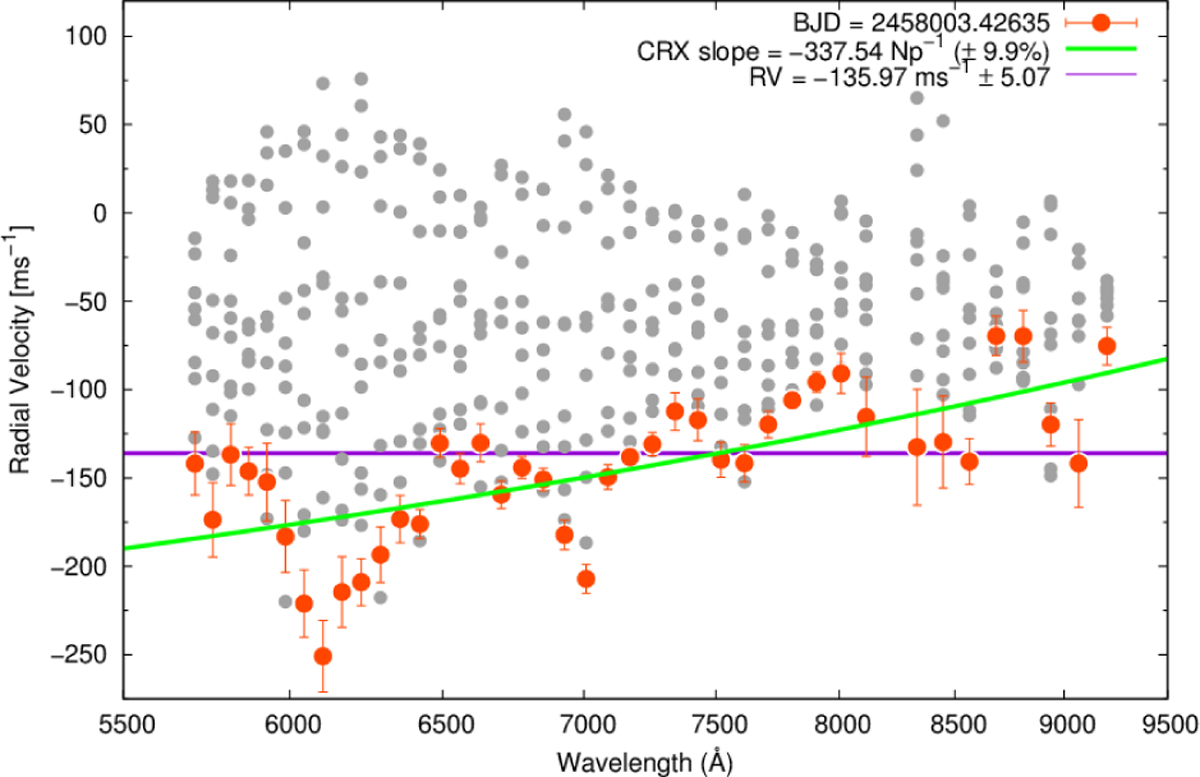
Illustration of the RV variation with wavelength, where the central wavelength is given for each order. Shown are the same data as in Fig. 2, with the steepest positive slope shown by red points. The green line indicates the slope of these points, which is the CRX-index for each individual spectrum. The weighted RV measurement is shown by the purple line. The wavelength spacing is logarithmic.
Current usage metrics show cumulative count of Article Views (full-text article views including HTML views, PDF and ePub downloads, according to the available data) and Abstracts Views on Vision4Press platform.
Data correspond to usage on the plateform after 2015. The current usage metrics is available 48-96 hours after online publication and is updated daily on week days.
Initial download of the metrics may take a while.