Fig. E.1
Download original image
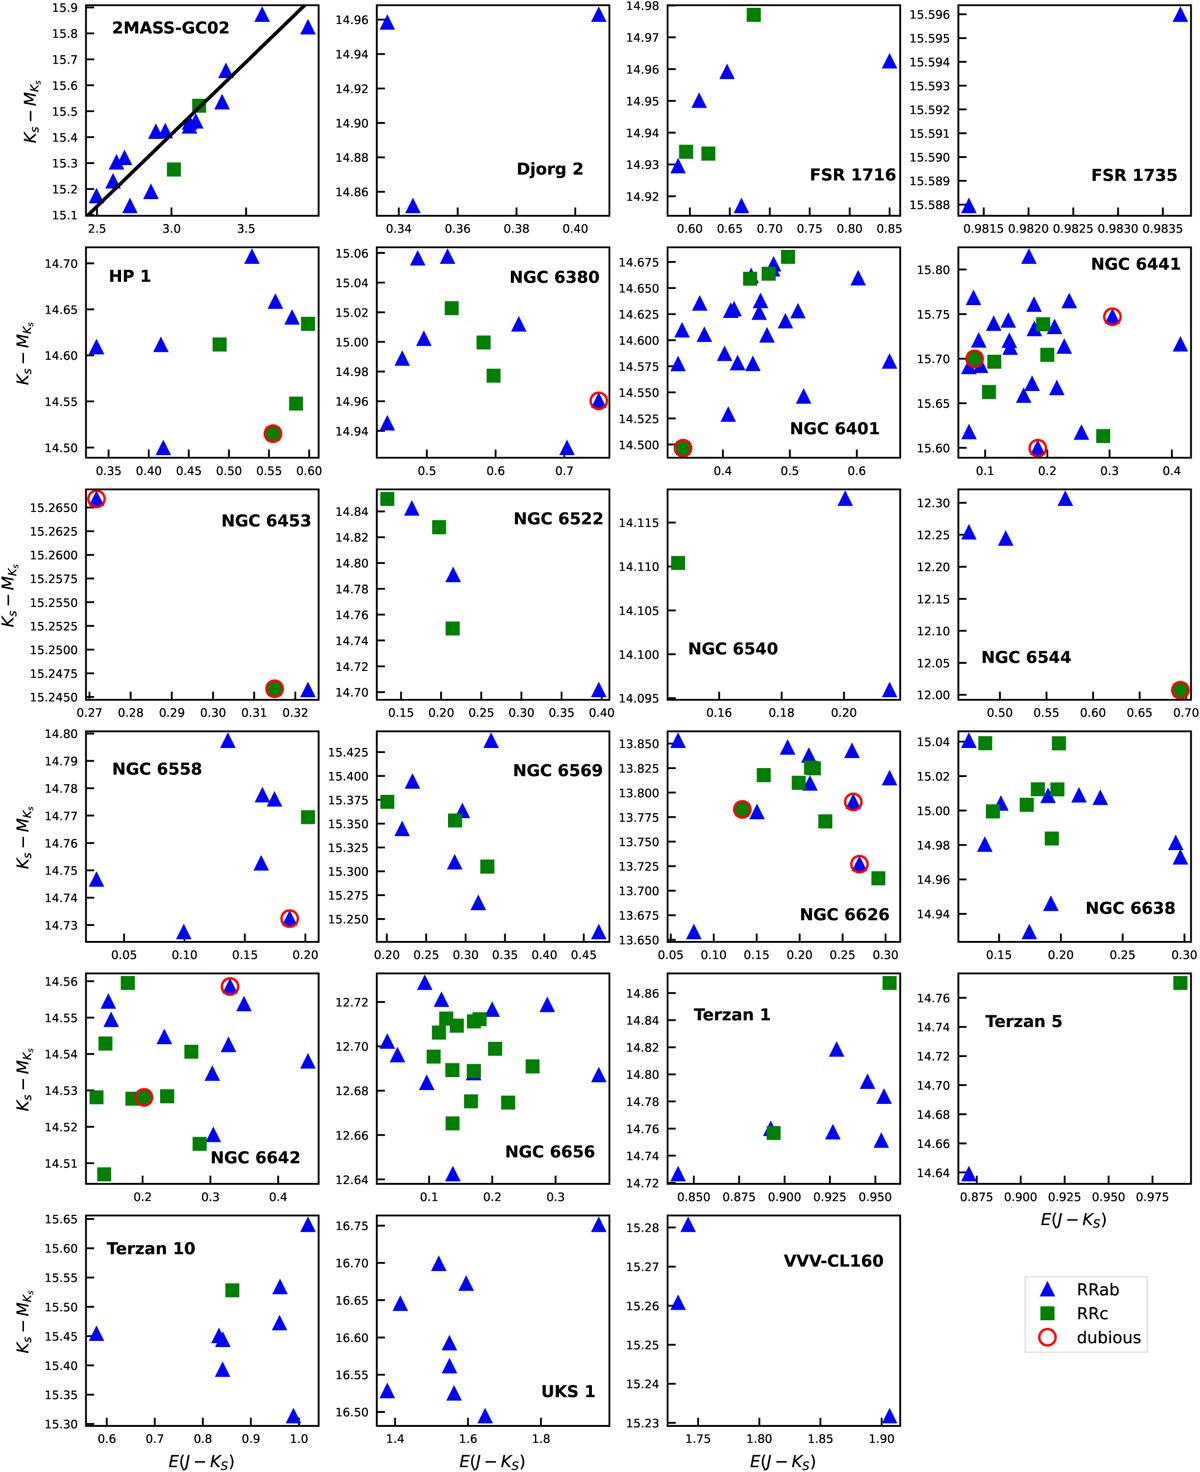
Apparent distance moduli versus color excesses for the RR Lyrae cluster members based on their near-infrared PLZ relations. RRab stars are shown as blue triangles, and RRc stars as green squares. Red circles enclose dubious candidates, which are not plotted if they exhibit large offsets. The significant differential reddening in 2MASS-GC02 leads to the high dispersion observed among its RR Lyrae members in the first panel. A solid black line shows the linear fit used to define the distance modulus and the selective-to-total extinction ratio to this GC (see Sect. 6)
Current usage metrics show cumulative count of Article Views (full-text article views including HTML views, PDF and ePub downloads, according to the available data) and Abstracts Views on Vision4Press platform.
Data correspond to usage on the plateform after 2015. The current usage metrics is available 48-96 hours after online publication and is updated daily on week days.
Initial download of the metrics may take a while.