Fig. 3
Download original image
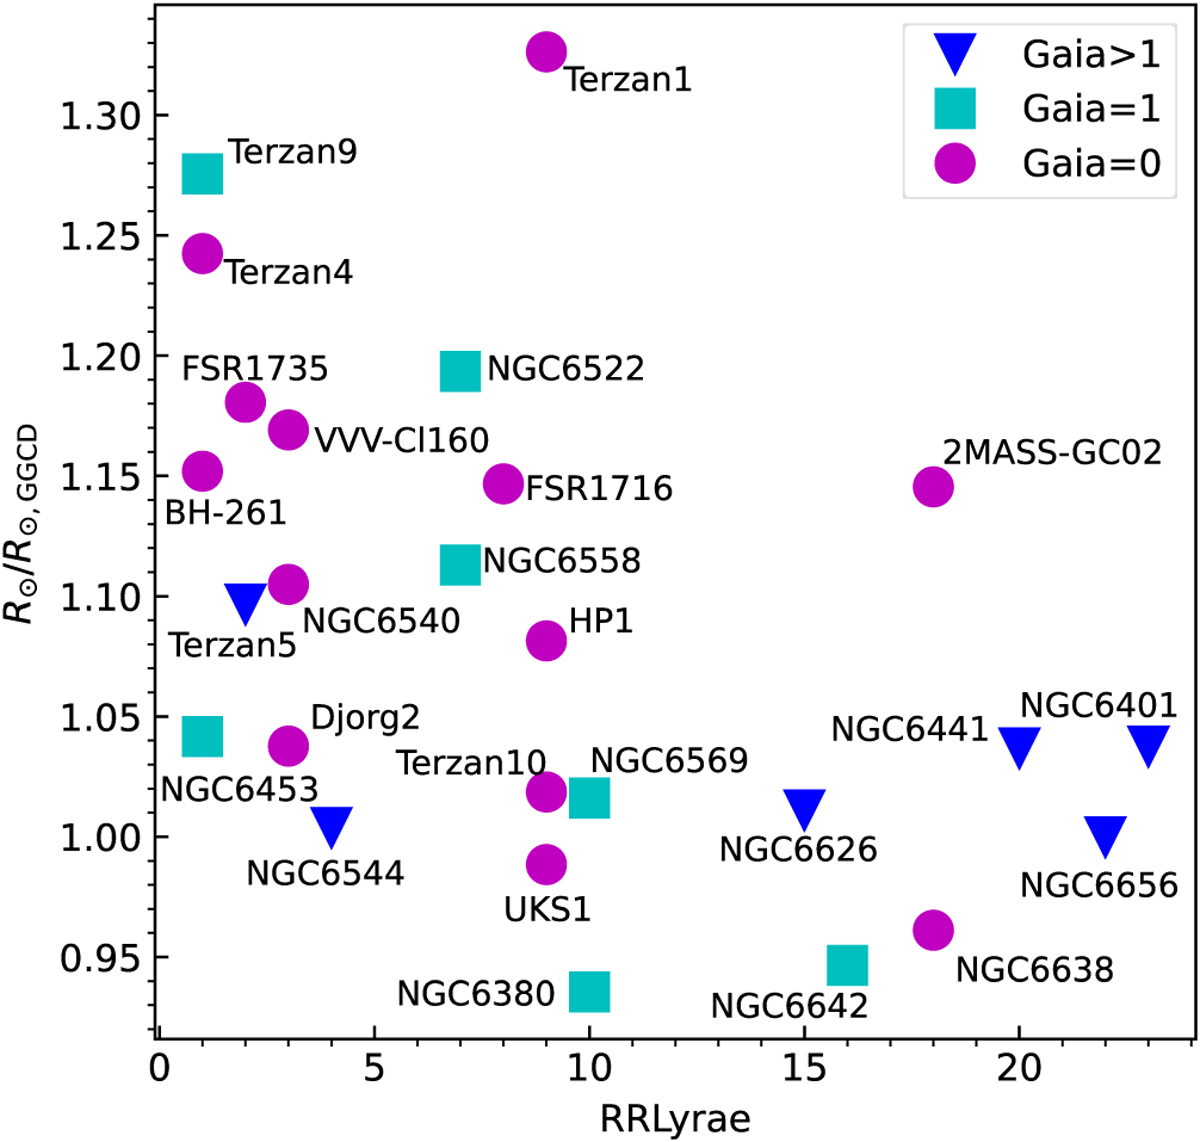
Ratio of distances calculated using RR Lyrae stars in the VVV GCs compared to those from the GGCD, plotted against the number of RR Lyrae stars present in each GCs. Blue inverted triangles represent GCs where Baumgardt & Vasiliev (2021) were able to apply several techniques based on Gaia and HST data to measure distances, cyan squares indicate GCs where only one technique was used, while magenta dots show GCs lacking Gaia or HST measurements, relying solely on distances reported in the literature.
Current usage metrics show cumulative count of Article Views (full-text article views including HTML views, PDF and ePub downloads, according to the available data) and Abstracts Views on Vision4Press platform.
Data correspond to usage on the plateform after 2015. The current usage metrics is available 48-96 hours after online publication and is updated daily on week days.
Initial download of the metrics may take a while.