Open Access
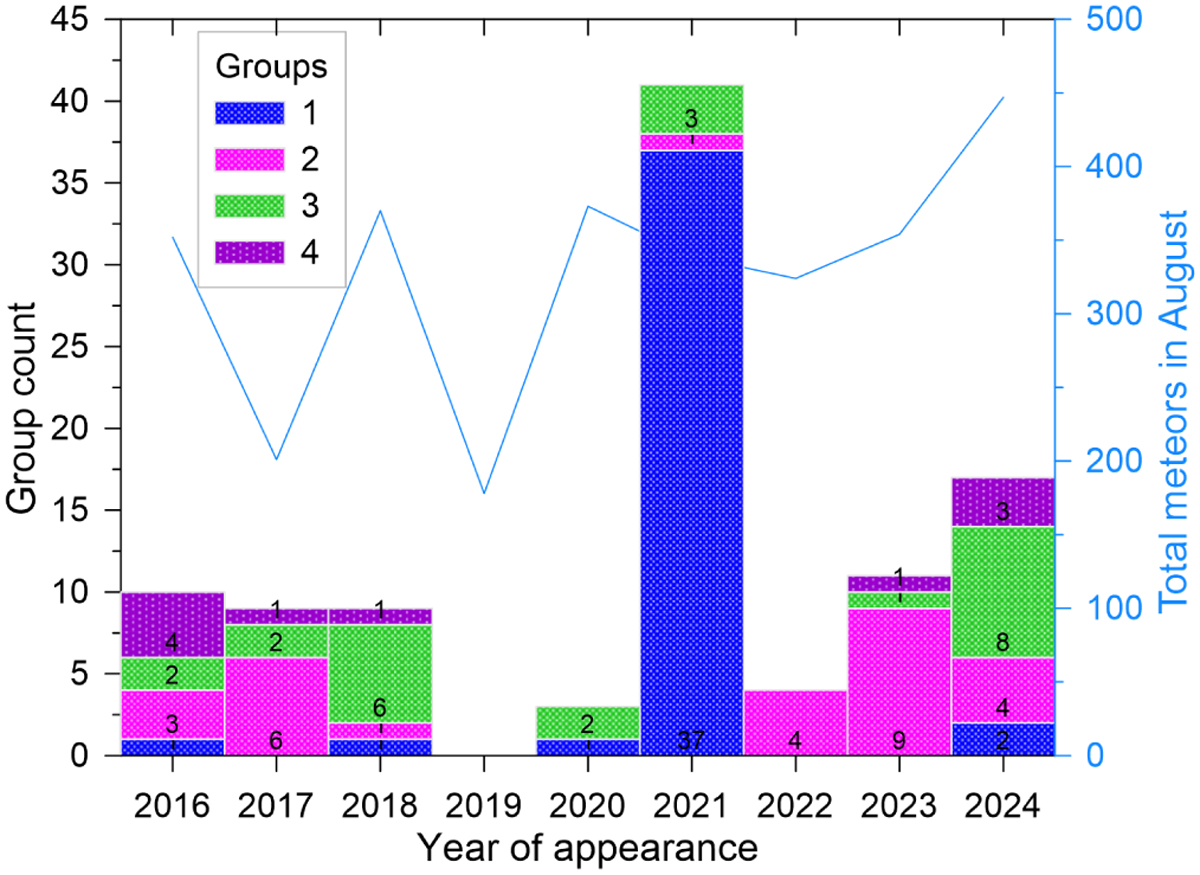
Fig. 9
Download original image
Histogram of year of appearances of meteors belonging to the cores of Groups 1 to 4. The four core members of Group 5 are not shown. They appeared in four different years (2020–2022, 2024). The solid blue line denotes the total number of meteors observed in August each year. The corresponding scale is on the right.
Current usage metrics show cumulative count of Article Views (full-text article views including HTML views, PDF and ePub downloads, according to the available data) and Abstracts Views on Vision4Press platform.
Data correspond to usage on the plateform after 2015. The current usage metrics is available 48-96 hours after online publication and is updated daily on week days.
Initial download of the metrics may take a while.