Fig. 9.
Download original image
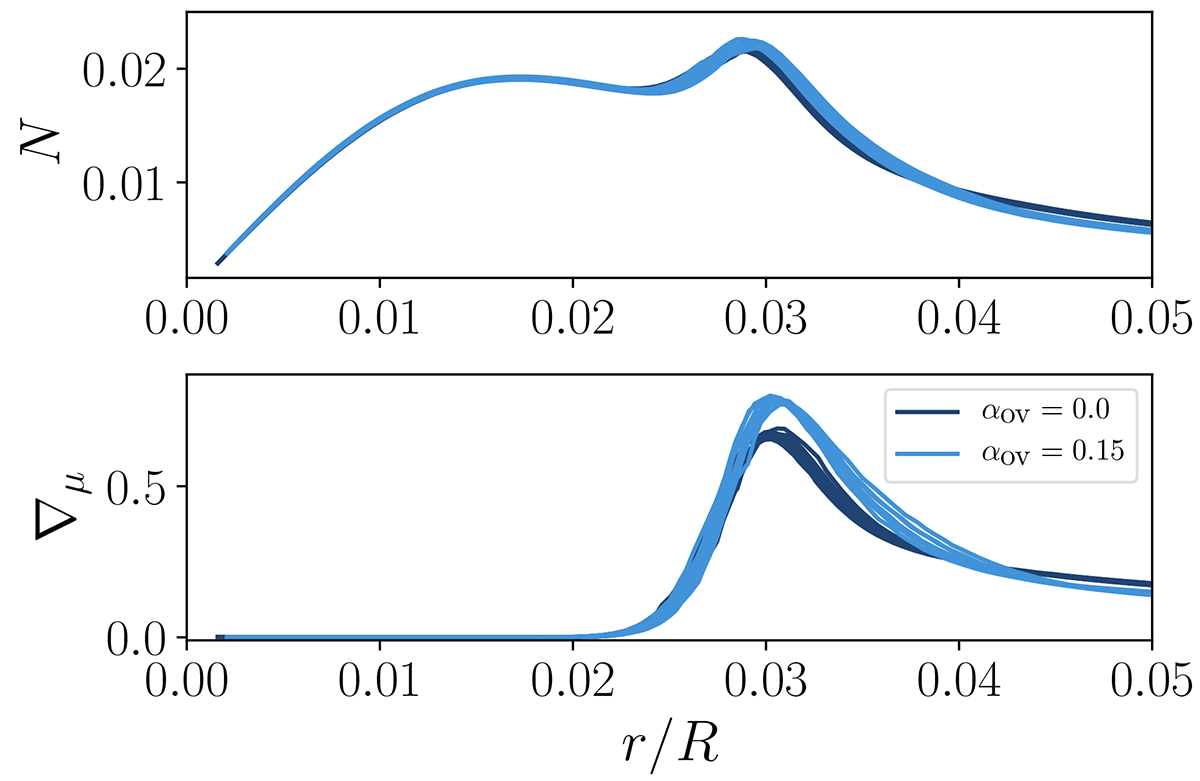
Top panel: Same Brunt-Väisälä frequency profiles as in Fig. 8 from the center to the H-shell. Bottom panel: Mean molecular weight of the optimal models over the same radius range as the upper panel. In both panels, dark blue corresponds to models without overshooting while light blue curves correspond to those with overshooting.
Current usage metrics show cumulative count of Article Views (full-text article views including HTML views, PDF and ePub downloads, according to the available data) and Abstracts Views on Vision4Press platform.
Data correspond to usage on the plateform after 2015. The current usage metrics is available 48-96 hours after online publication and is updated daily on week days.
Initial download of the metrics may take a while.