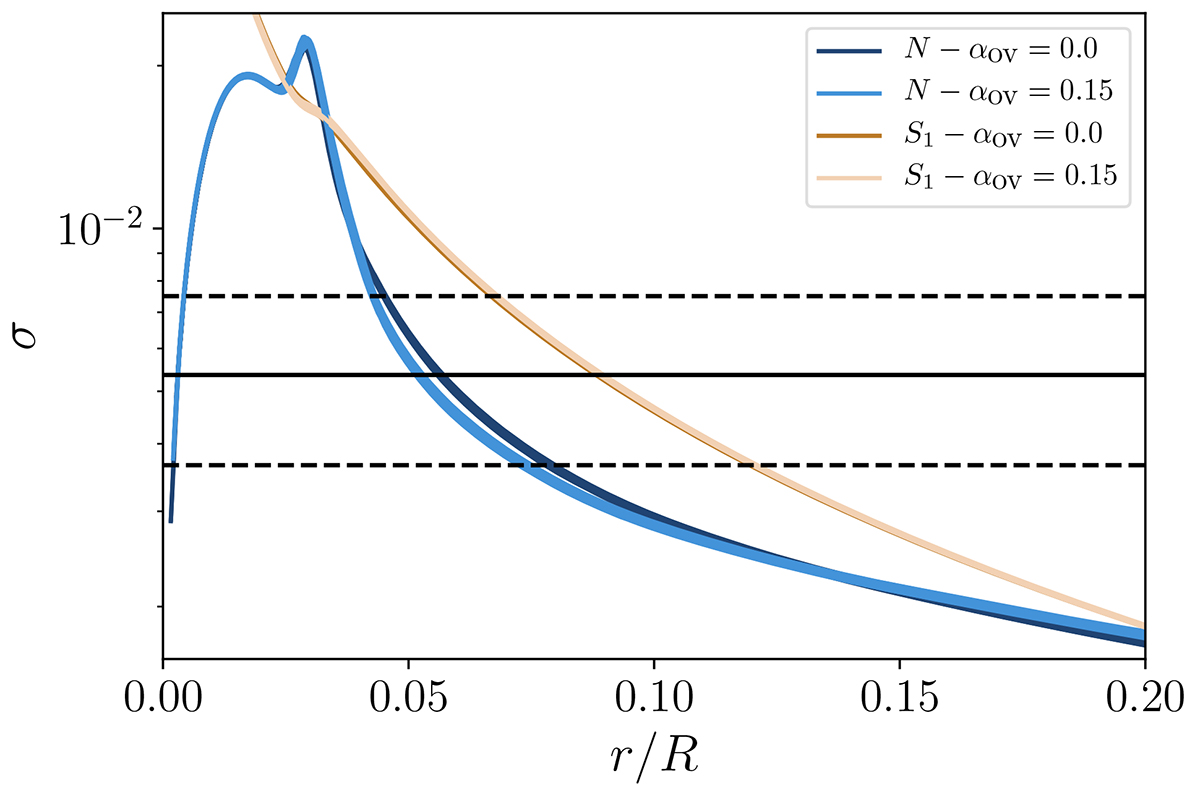
Fig. 8.
Download original image
Propagation diagram for all of the optimal models presented in Sect. 4.2.1. The Brunt-Väisälä frequency of the models without overshooting (resp. with αov = 0.15) is represented as a function of the reduced radius in dark blue (resp. light blue). The Lamb frequency of dipolar modes is shown in brown (resp. beige) for models without (resp. with) overshooting. The black continuous line corresponds to the frequency at maximum power and the dashed black lines correspond to the observed frequency range.
Current usage metrics show cumulative count of Article Views (full-text article views including HTML views, PDF and ePub downloads, according to the available data) and Abstracts Views on Vision4Press platform.
Data correspond to usage on the plateform after 2015. The current usage metrics is available 48-96 hours after online publication and is updated daily on week days.
Initial download of the metrics may take a while.