Fig. 7.
Download original image
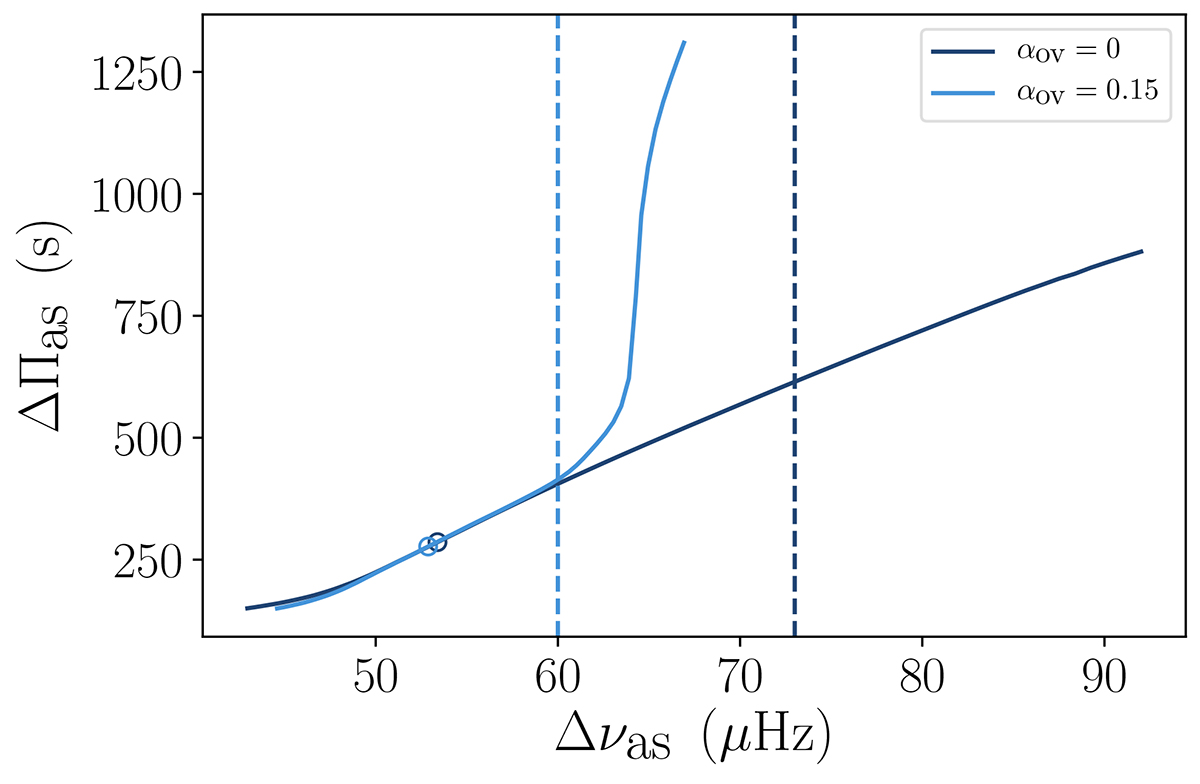
Evolution (from right to left) of ΔΠas as a function of Δνas for models with an initial composition of X0 = 0.70 and Z0 = 0.017 either including overshooting (αov = 0.15, light blue) or not (dark blue). The evolution, from right to left, starts at the late main-sequence phase and evolves past the beginning of the subgiant phase (symbolised by the vertical dashed lines). The best fit models for each prescription are shown with the empty circles.
Current usage metrics show cumulative count of Article Views (full-text article views including HTML views, PDF and ePub downloads, according to the available data) and Abstracts Views on Vision4Press platform.
Data correspond to usage on the plateform after 2015. The current usage metrics is available 48-96 hours after online publication and is updated daily on week days.
Initial download of the metrics may take a while.